Welcome to TrendsAI! This article provides an overview of the different sections in the TrendsAI dashboard, and how to use the features within those sections to gain a greater insight into your data.
TrendsAI can be accessed via the TrendsAI link in the left-hand navigation bar in the project dashboard.
If you can't see the TrendsAI link, you may need to have it activated for you - for more info see Introduction to TrendsAI.
TrendsAI has three main sections - charts, comments list and topics. We'll explore these in more detail below, but for now, here's a quick overview:
Charts section
The charts section provides an overview of your project with summary charts - such as the top topics the model has identified, and the sentiment associated with each one.
Comments list
The comments list is a table of all the free text responses on your project. For each comment you can see some useful info - such as the topic the TrendsAI model has assigned to it, as well as the date the comment was made and the ID of the contribution the comment came from.
Topics section
The topics section contains a table of topics identified by the model, as well as any custom topics you have created yourself. Here you can also find AI summaries of all of the responses for a particular topic.
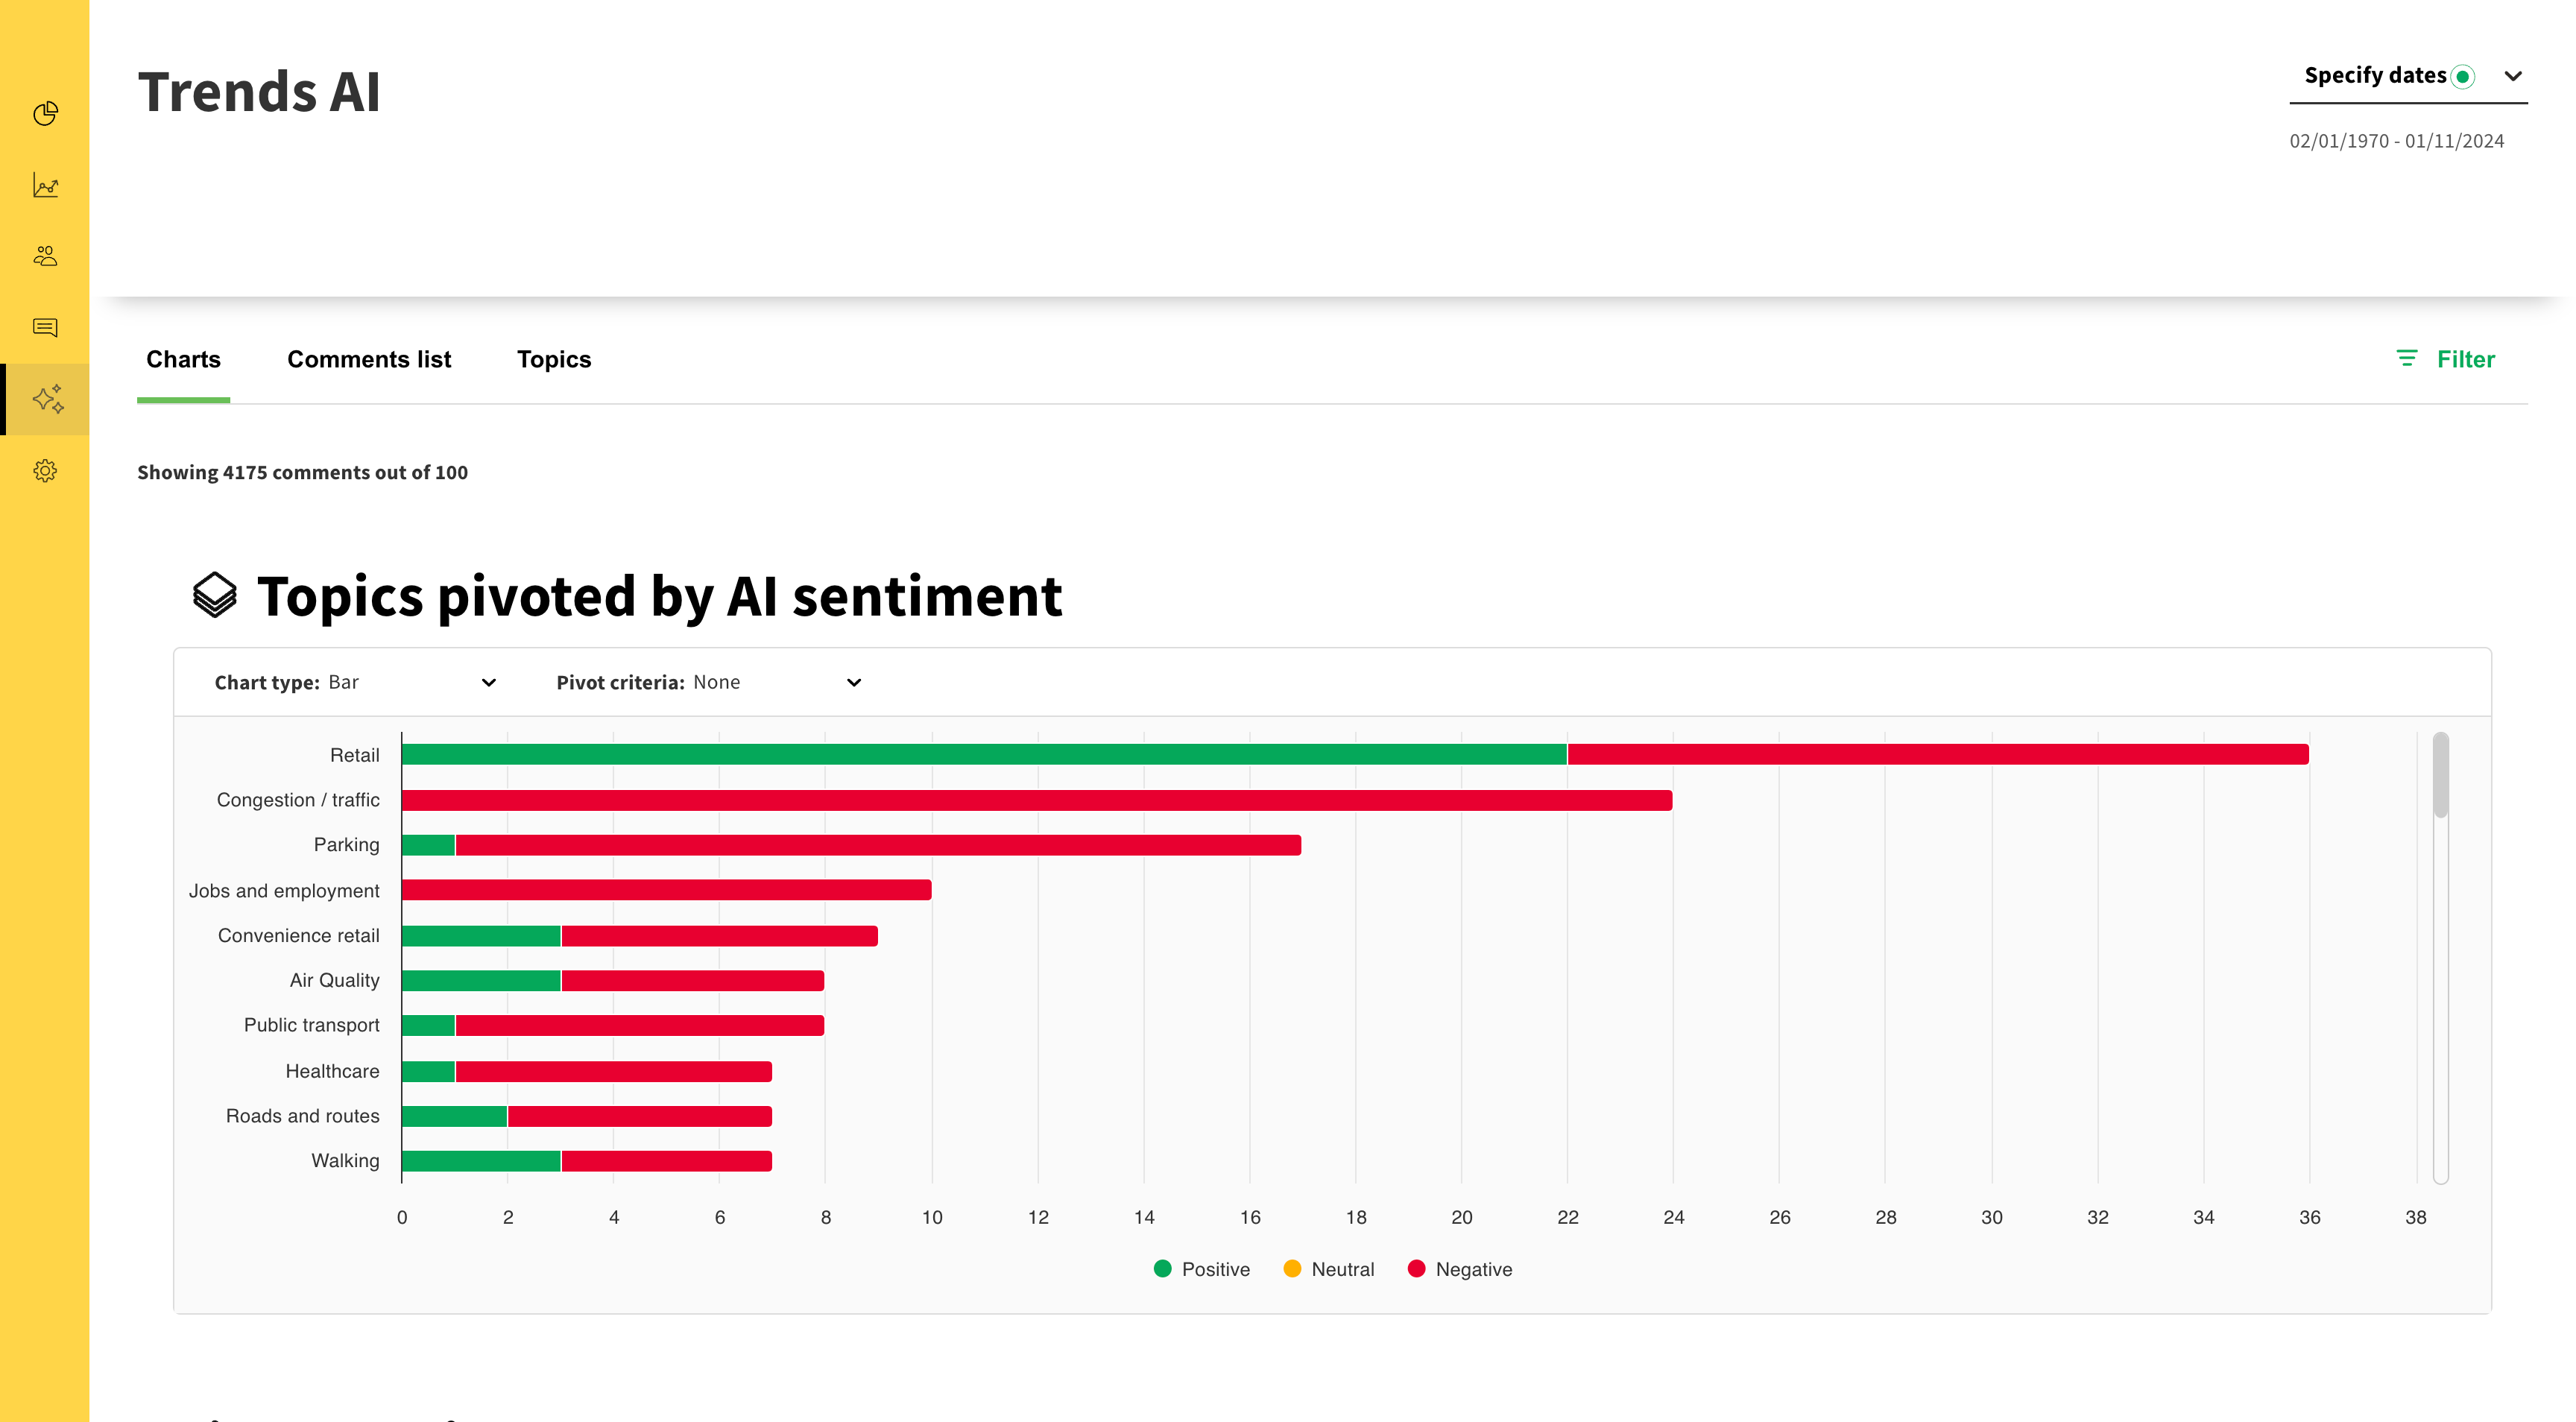
Above: An example of the charts section
The charts section provides an overview of topics on your project and the AI-generated sentiments associated with those topics. We'll explore topics and sentiments more in the sections below, but for now all you need to know is that topics are themes that occur in the comments your project received.
Here's a selection of the charts on this page:
Topics pivoted by AI sentiment
This chart shows a list of all the topics on your project, in descending order - this is broken down by each topic's AI sentiment (i.e. the AI model's view of whether the topic was mentioned in a positive, negative or neutral context). Please note that while this chart only shows around 10 topics at a time, it can be scrolled to view topics beyond the most frequently mentioned.
AI sentiment
This chart shows an overall breakdown of AI sentiment across all comments.
Answers
This word cloud shows the most frequently used keywords across all comments - the size of the words corresponds to how frequently it was mentioned.
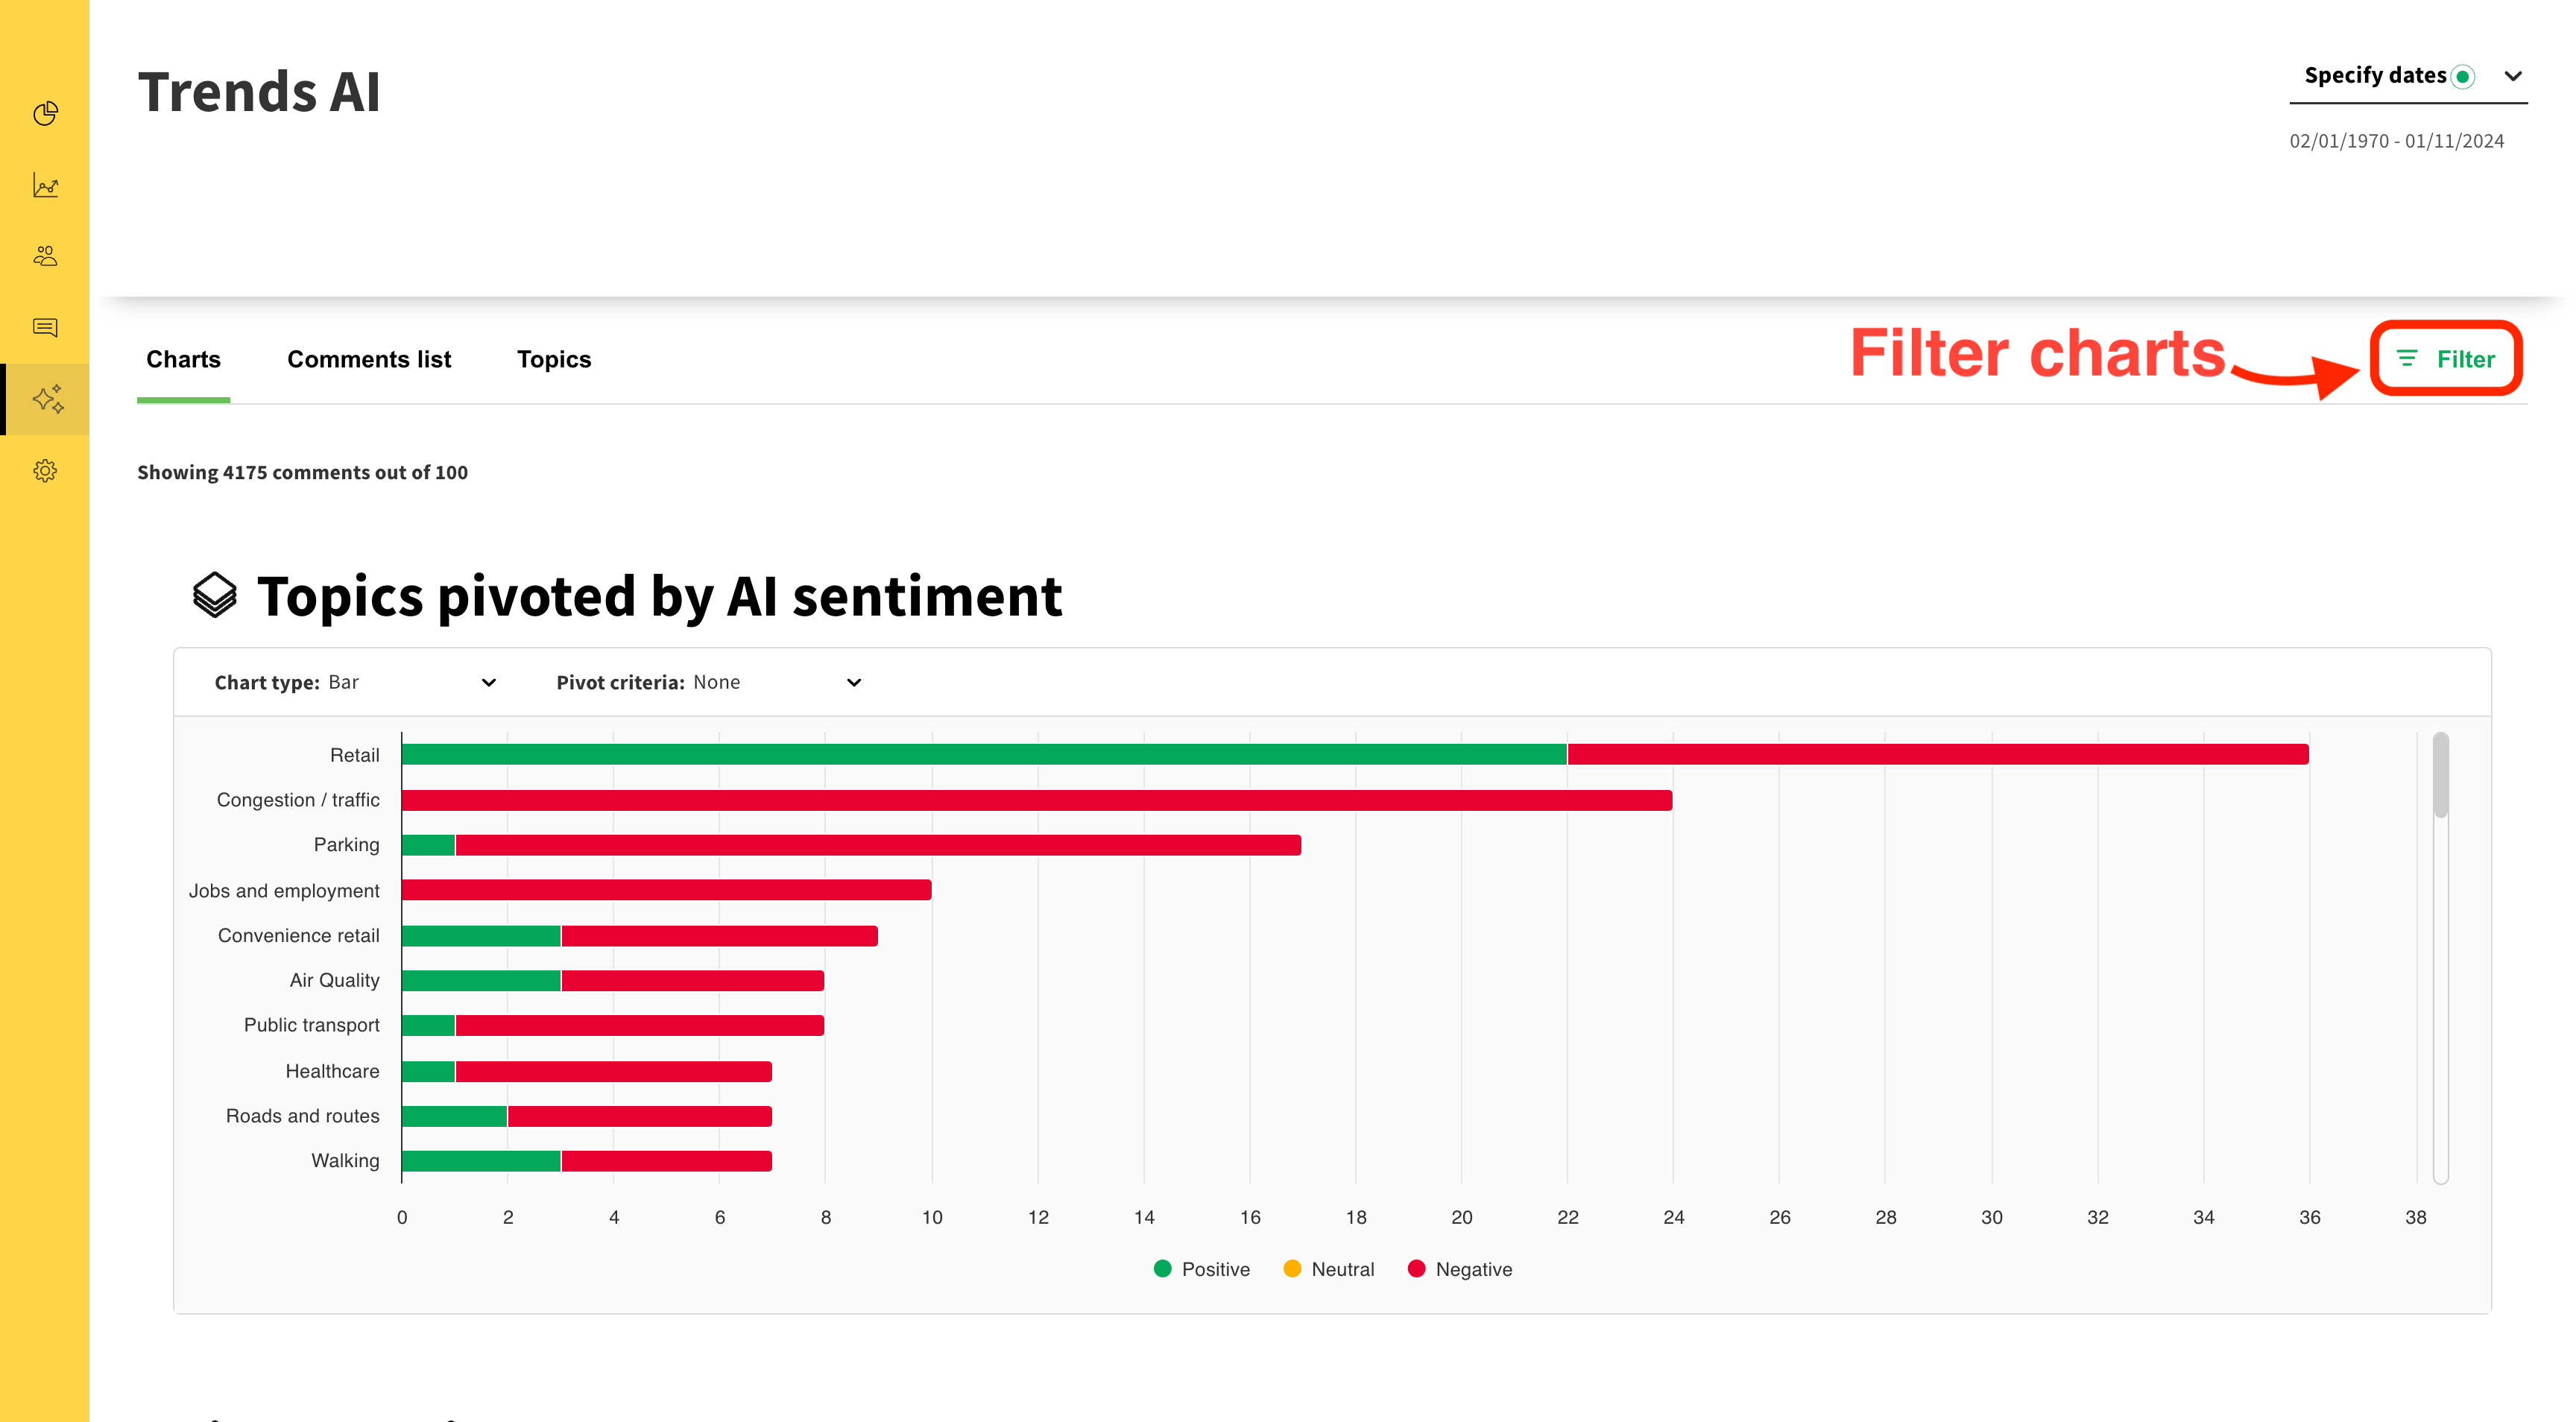
Filters can be applied to the charts by clicking the 'Filter' button.
Here are some examples of filters you may want to try:
Question
Filtering by question allows you to see an overview of only the topics mentioned in comments made in response to a particular survey question.
Topic
If you'd like to see an overview of just a select few topics, create a filter for those particular topics - remember that you can include more than one topic in a filter.
AI sentiment
Filtering by AI sentiment allows you to see only the instances where topics where mentioned in a positive, negative or neutral context.
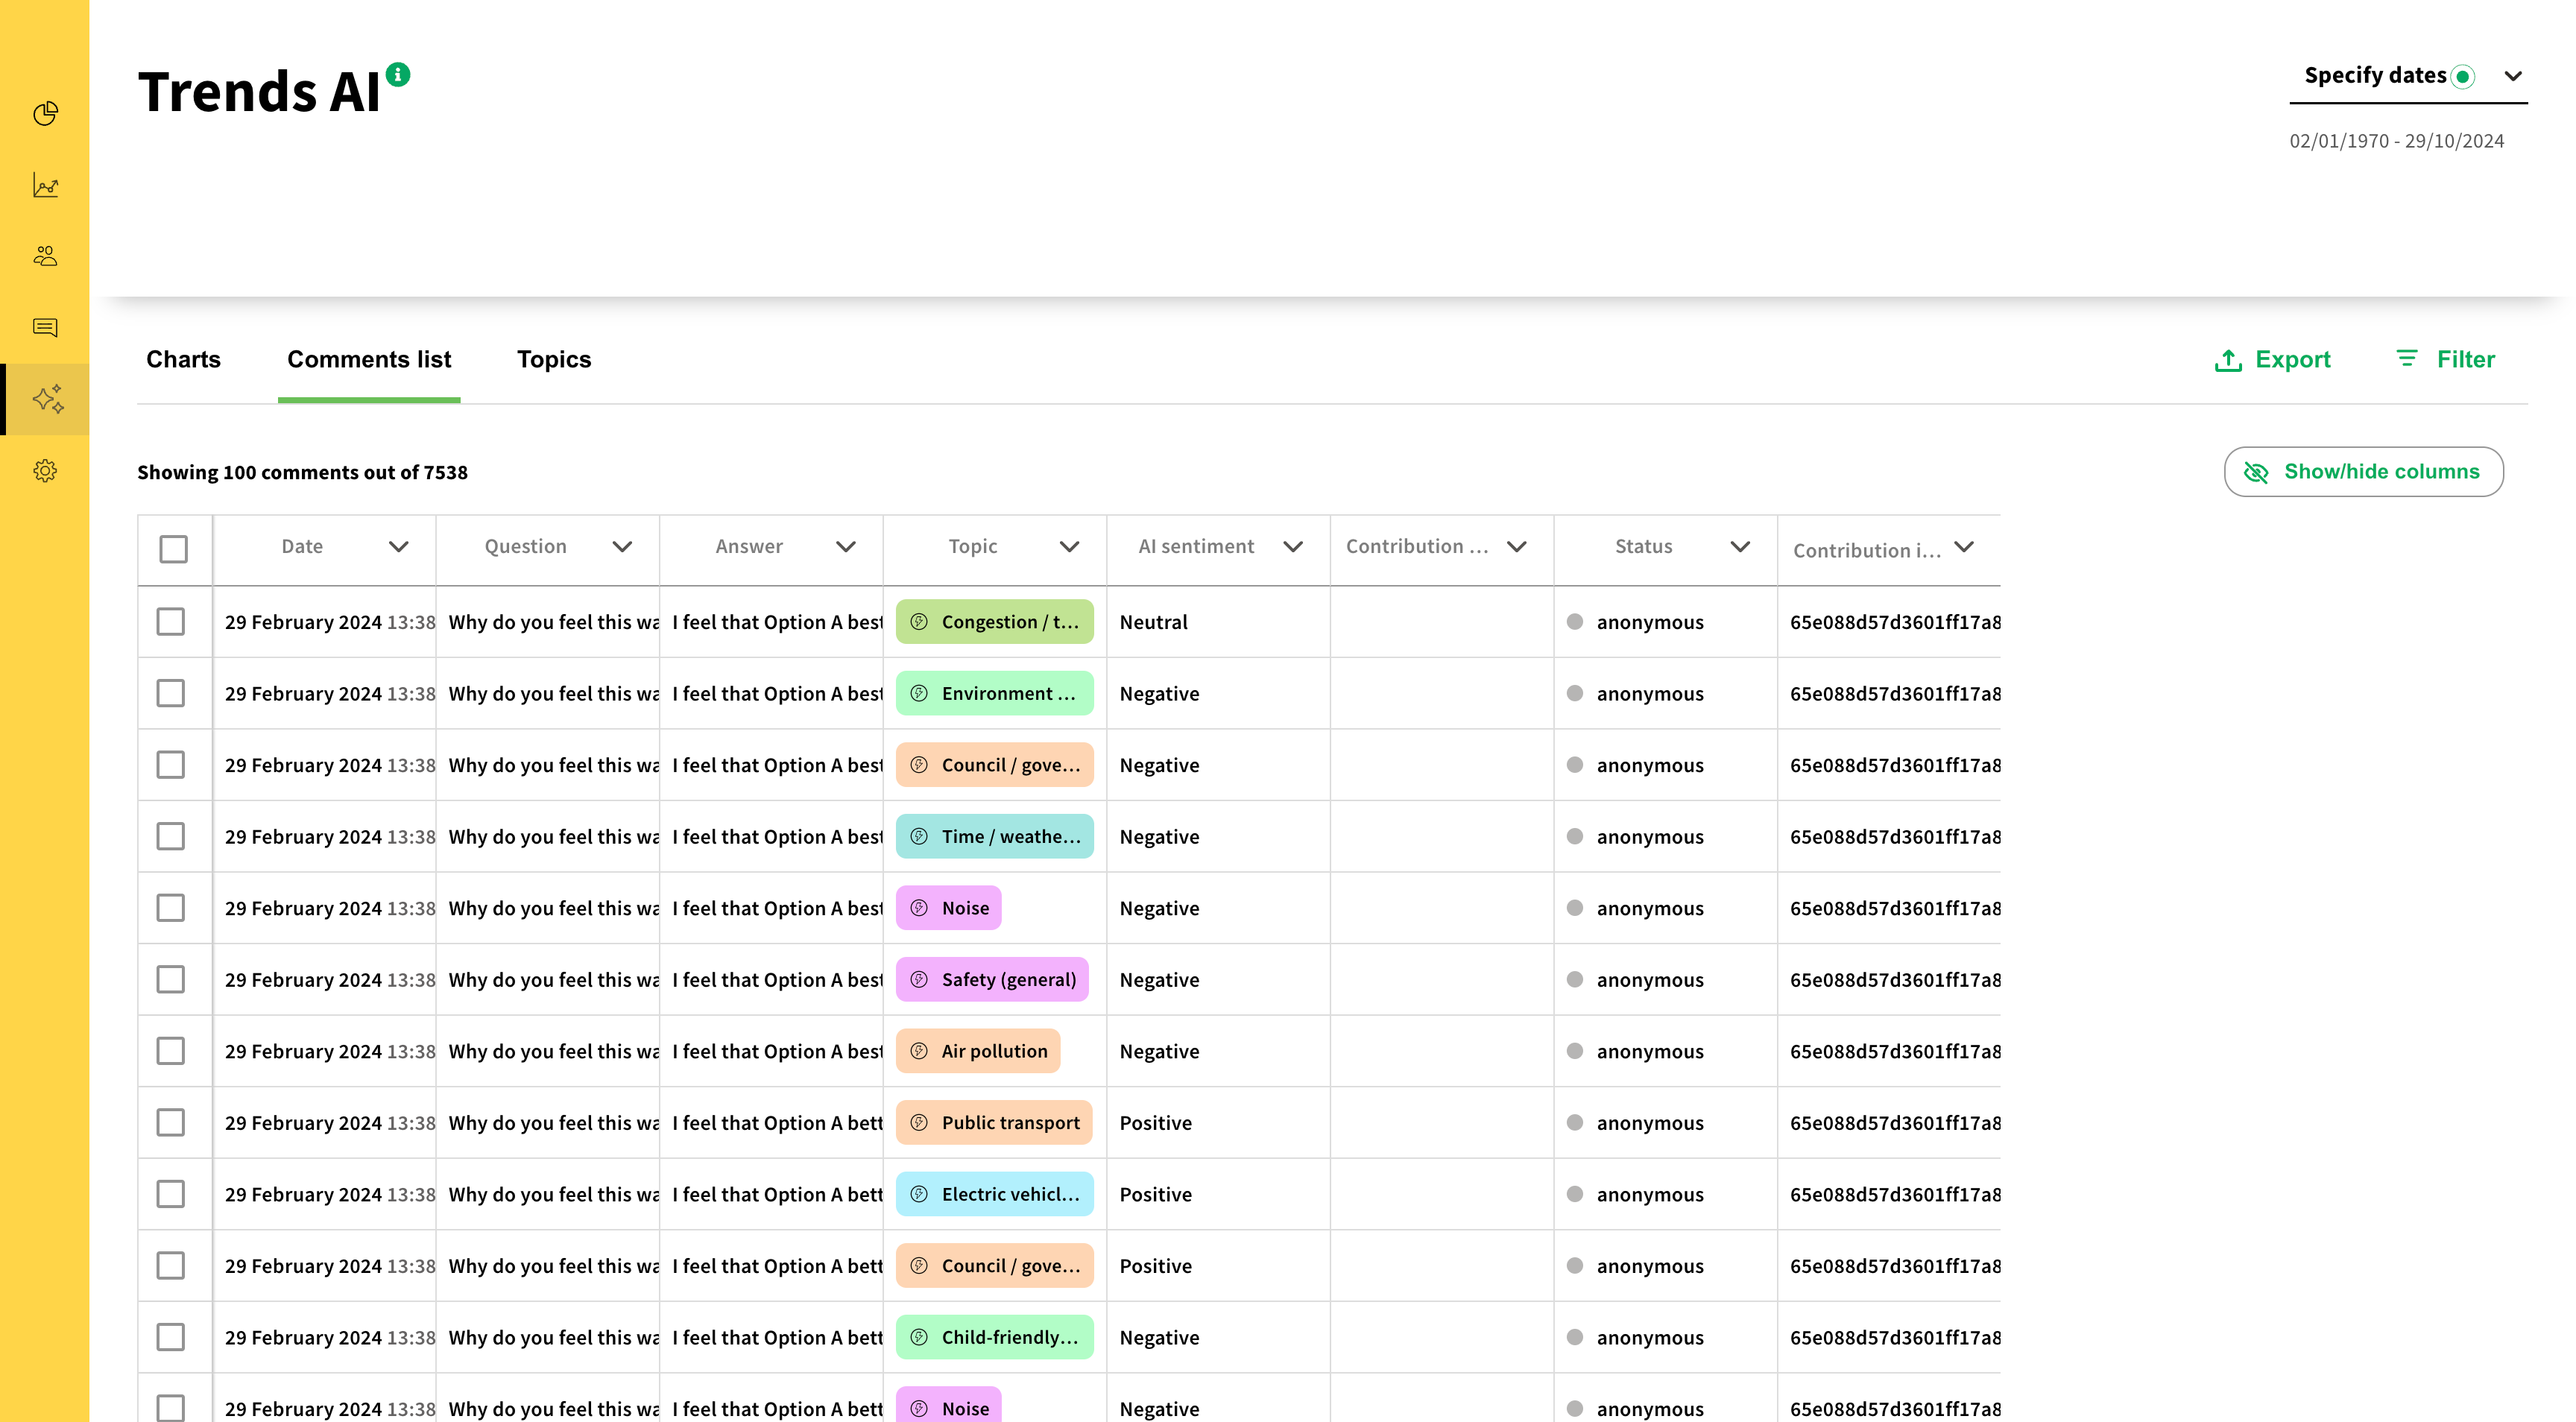
Above: An example of the comments list section
The comments list shows you a list of free text answers your respondents have given in response to your survey questions.
The comments list contains the following columns:
Date
The date that the comment was made.
Question
The question the free text comment was in response to - such as 'Why do you feel this way?' or 'Do you have any other comments?'.
Answer
The actual free text comment.
Topic
The topic assigned to the comment by the TrendsAI model. For example, the following comment might be assigned the topics 'Air pollution' and 'Congestion / traffic':
"Because traffic will be forced (like last time) to the roads on the perimeter, causing more tail backs, slower moving traffic, and therefore more pollution. Traffic needs to flow to improve air quality."
Each row in the table represents one comment, with one topic - so the comment above would appear twice in the comments list, once with the topic 'Air pollution' and once with the topic 'Congestion / traffic'.
AI sentiment
The AI model's view of whether the topic was mentioned in a positive, negative or neutral context - for example, was building height mentioned as a concern or a benefit.
Contribution sentiment
Whether the contribution was positive, negative or neutral overall - for more info about contributions, see below.
Status
The status of the contribution - i.e. whether or not the respondent clicked the confirmation link we sent to them when they signed up.
Contribution ID
On Commonplace, a contribution is a survey response. A Commonplace survey can be made up of a mix of different question types, including more than one free text question - so any given contribution ID may appear in the table multiple times.
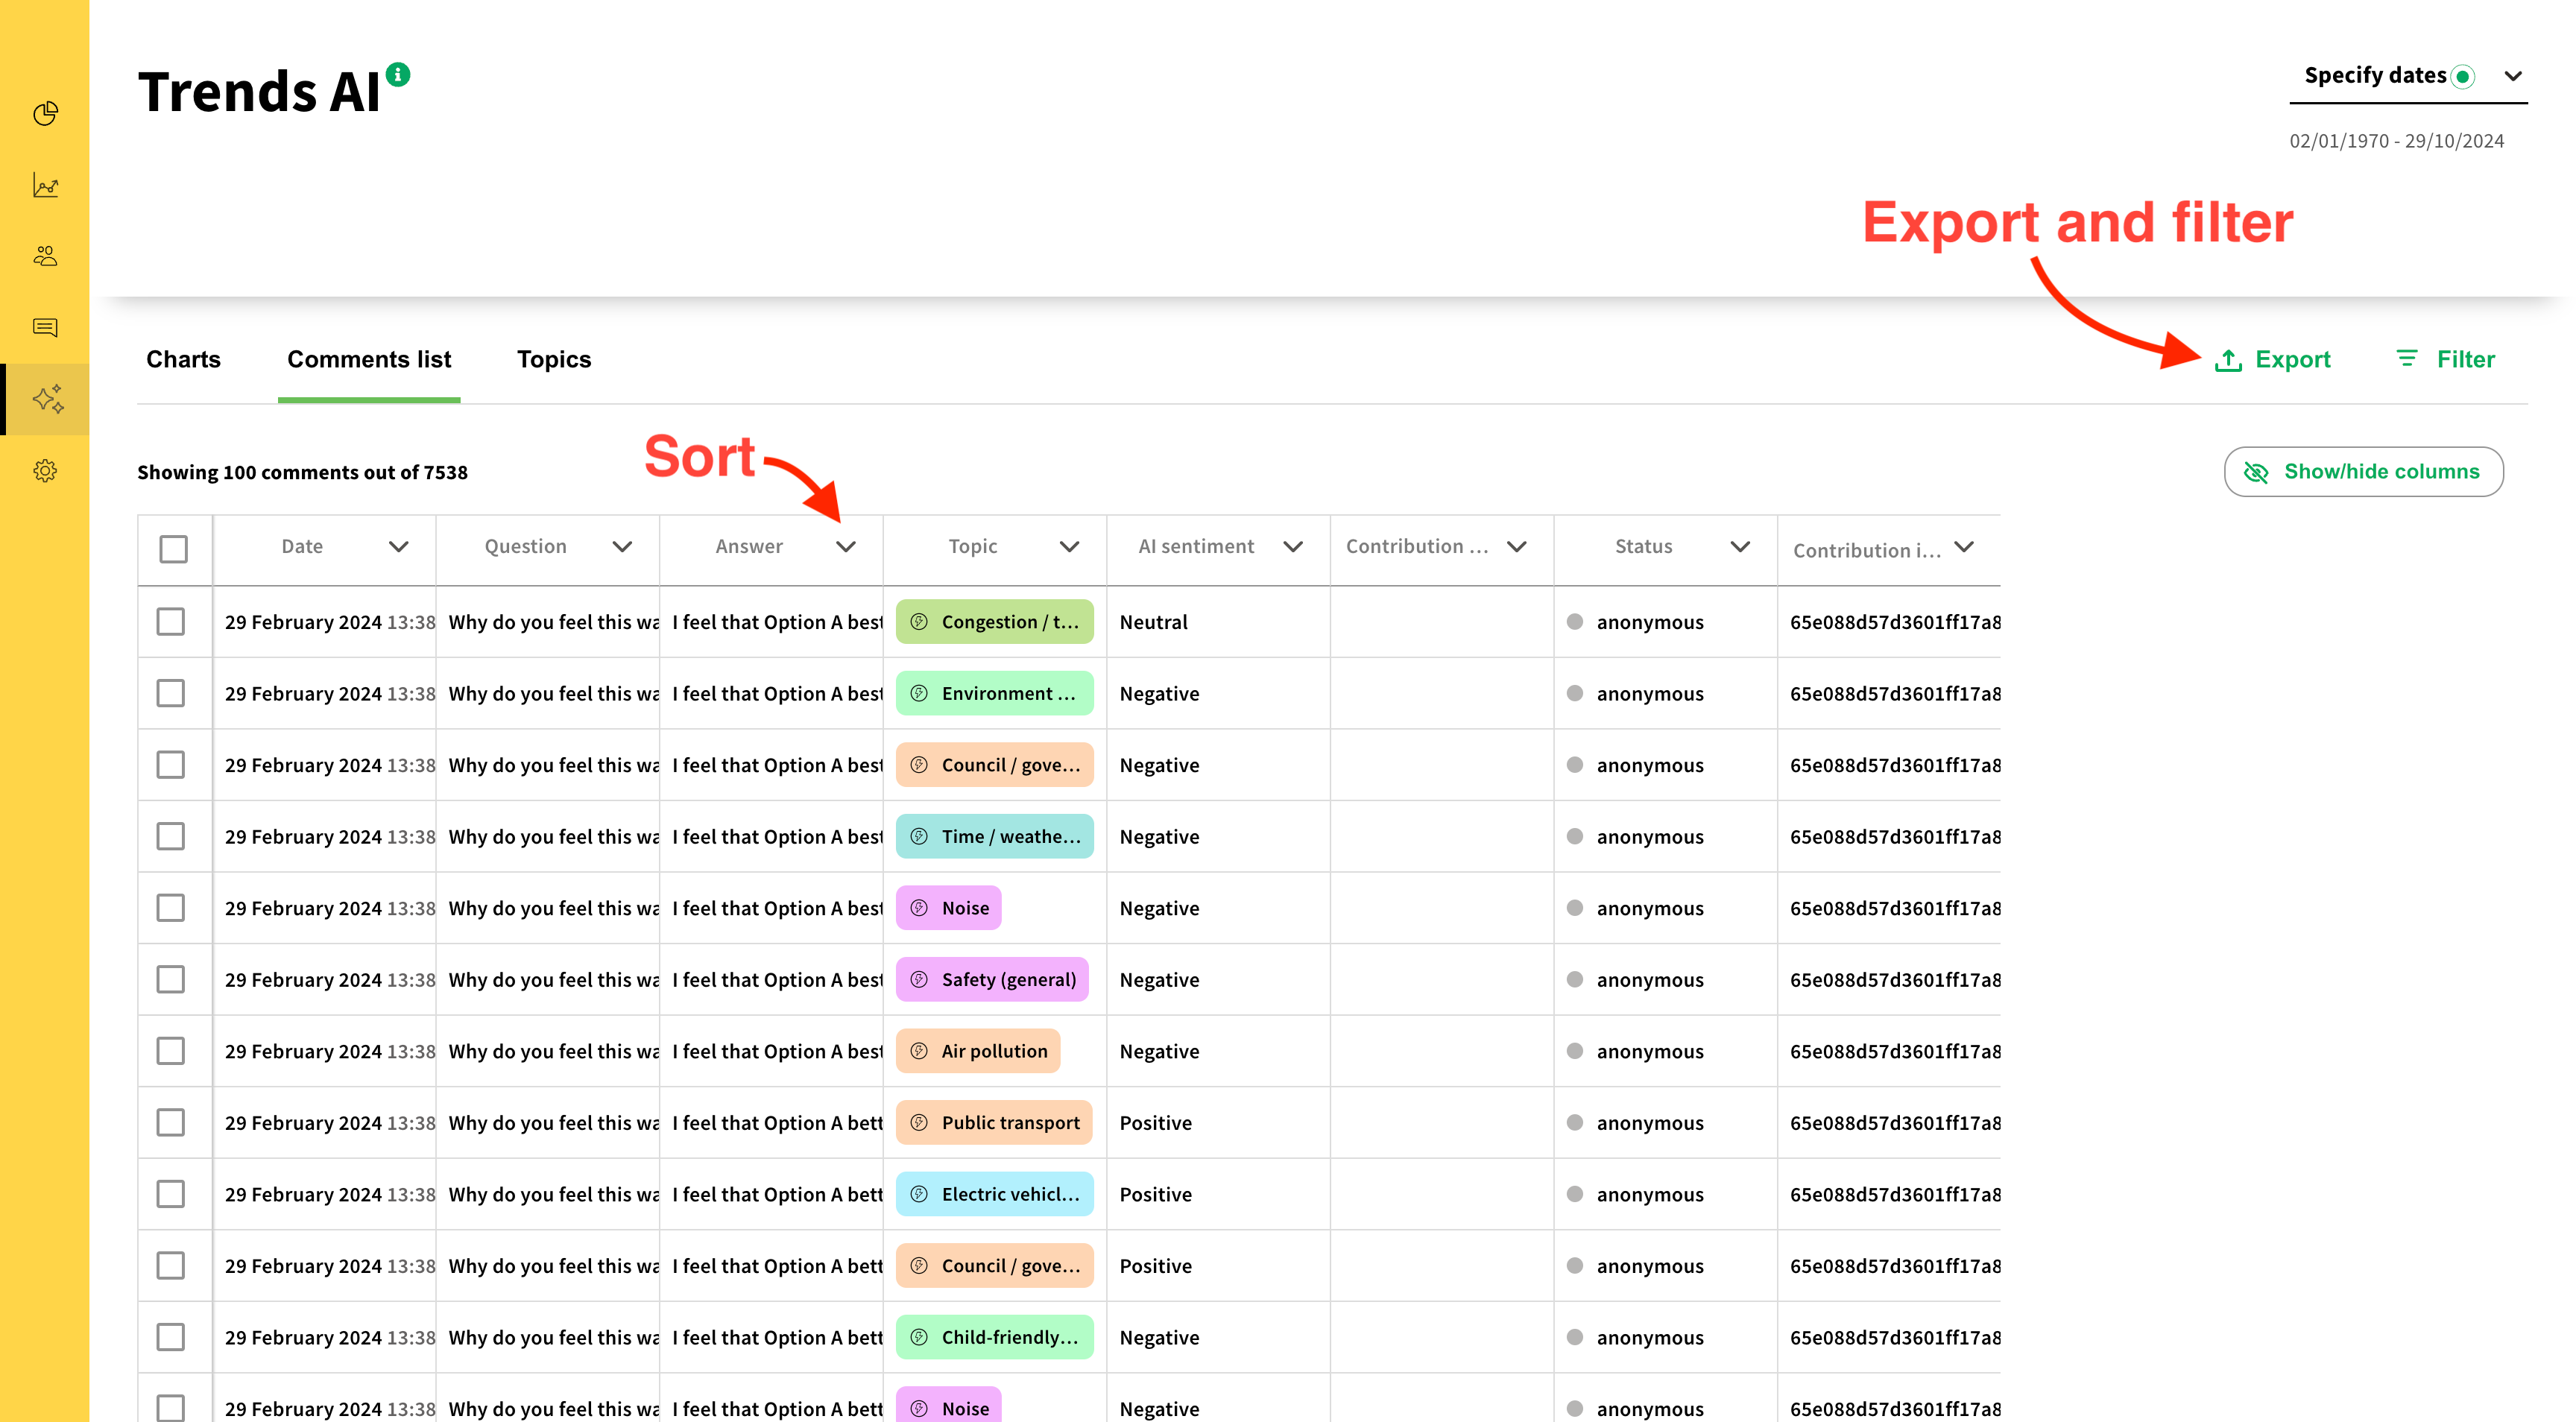
The table can be sorted, filtered or exported in much the same way as tables in the Respondents or Contributions sections of the dashboard.
To sort the table, click the down arrow to the right of the column heading.
To export the data, click the 'Export' button - you will receive an email containing a link to a CSV of the data.
To filter the table, click the 'Filter' button. Here are some examples of filters you may want to try:
Question
Filter by question in order to only see the comments made in response to that question.
Topic
Filter by topic to see all the free text comments that have been associated with a specific topic.
Status
Filter by status to see only the responses where, say, a respondent has confirmed their email address.

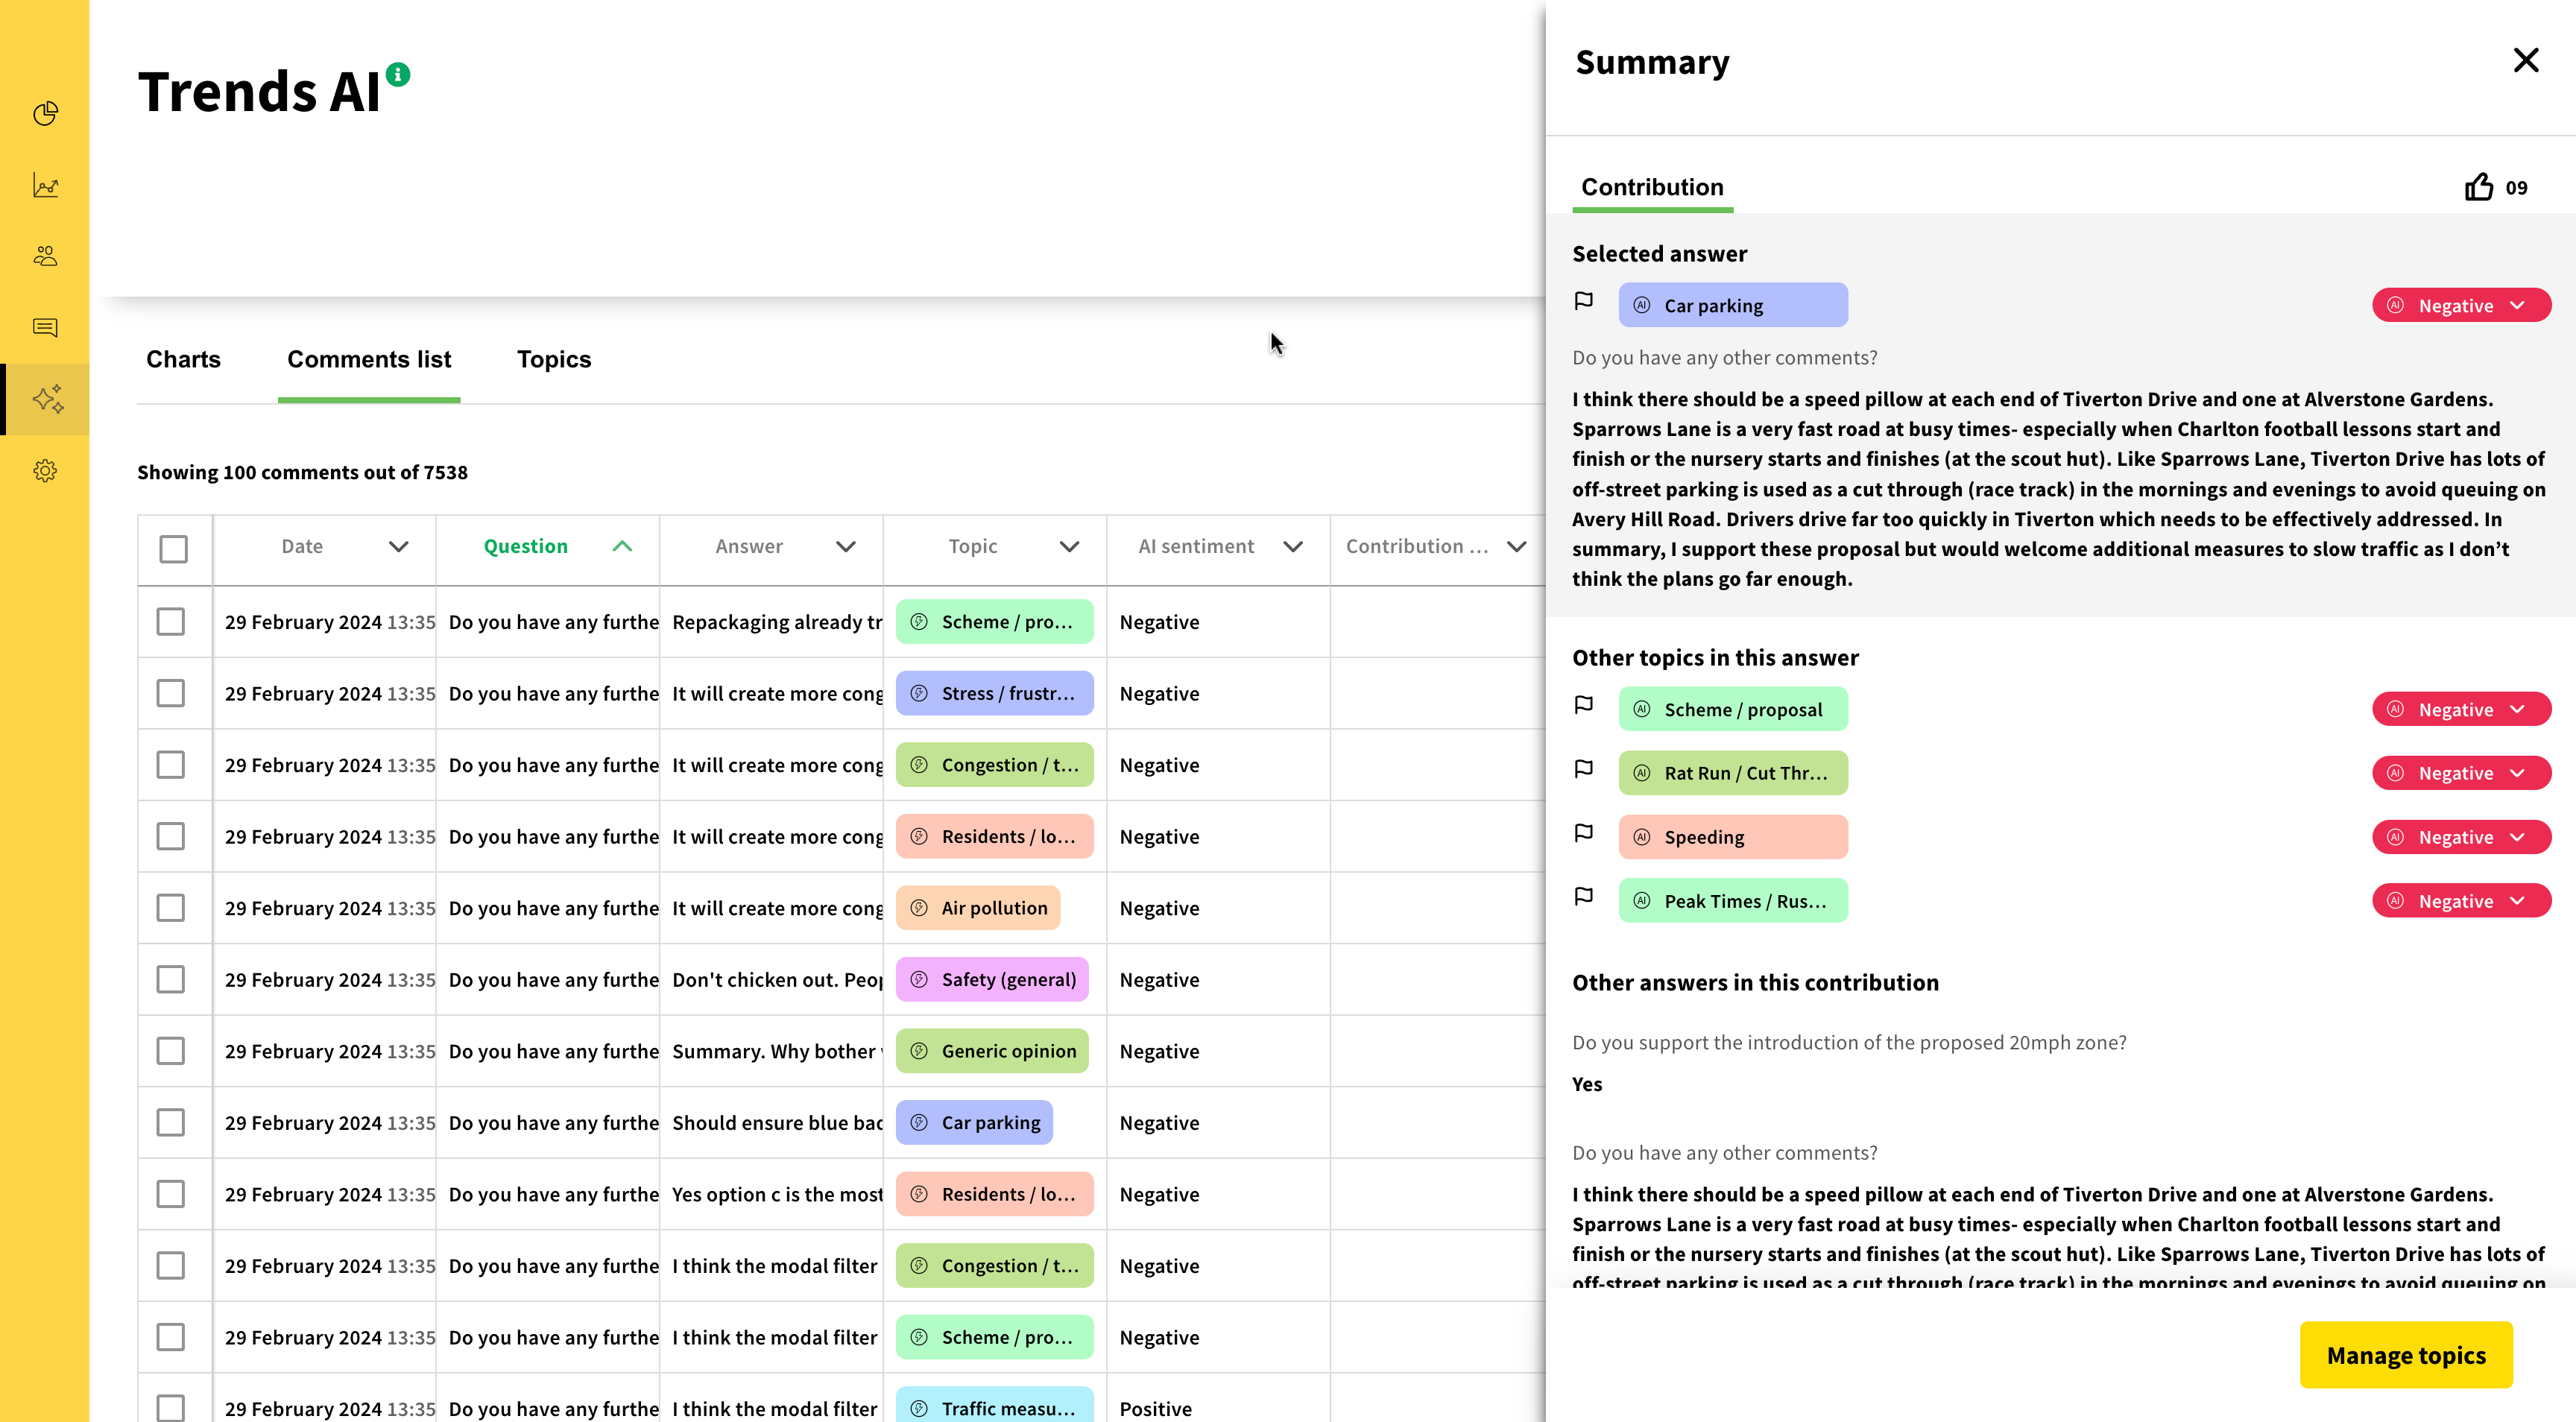
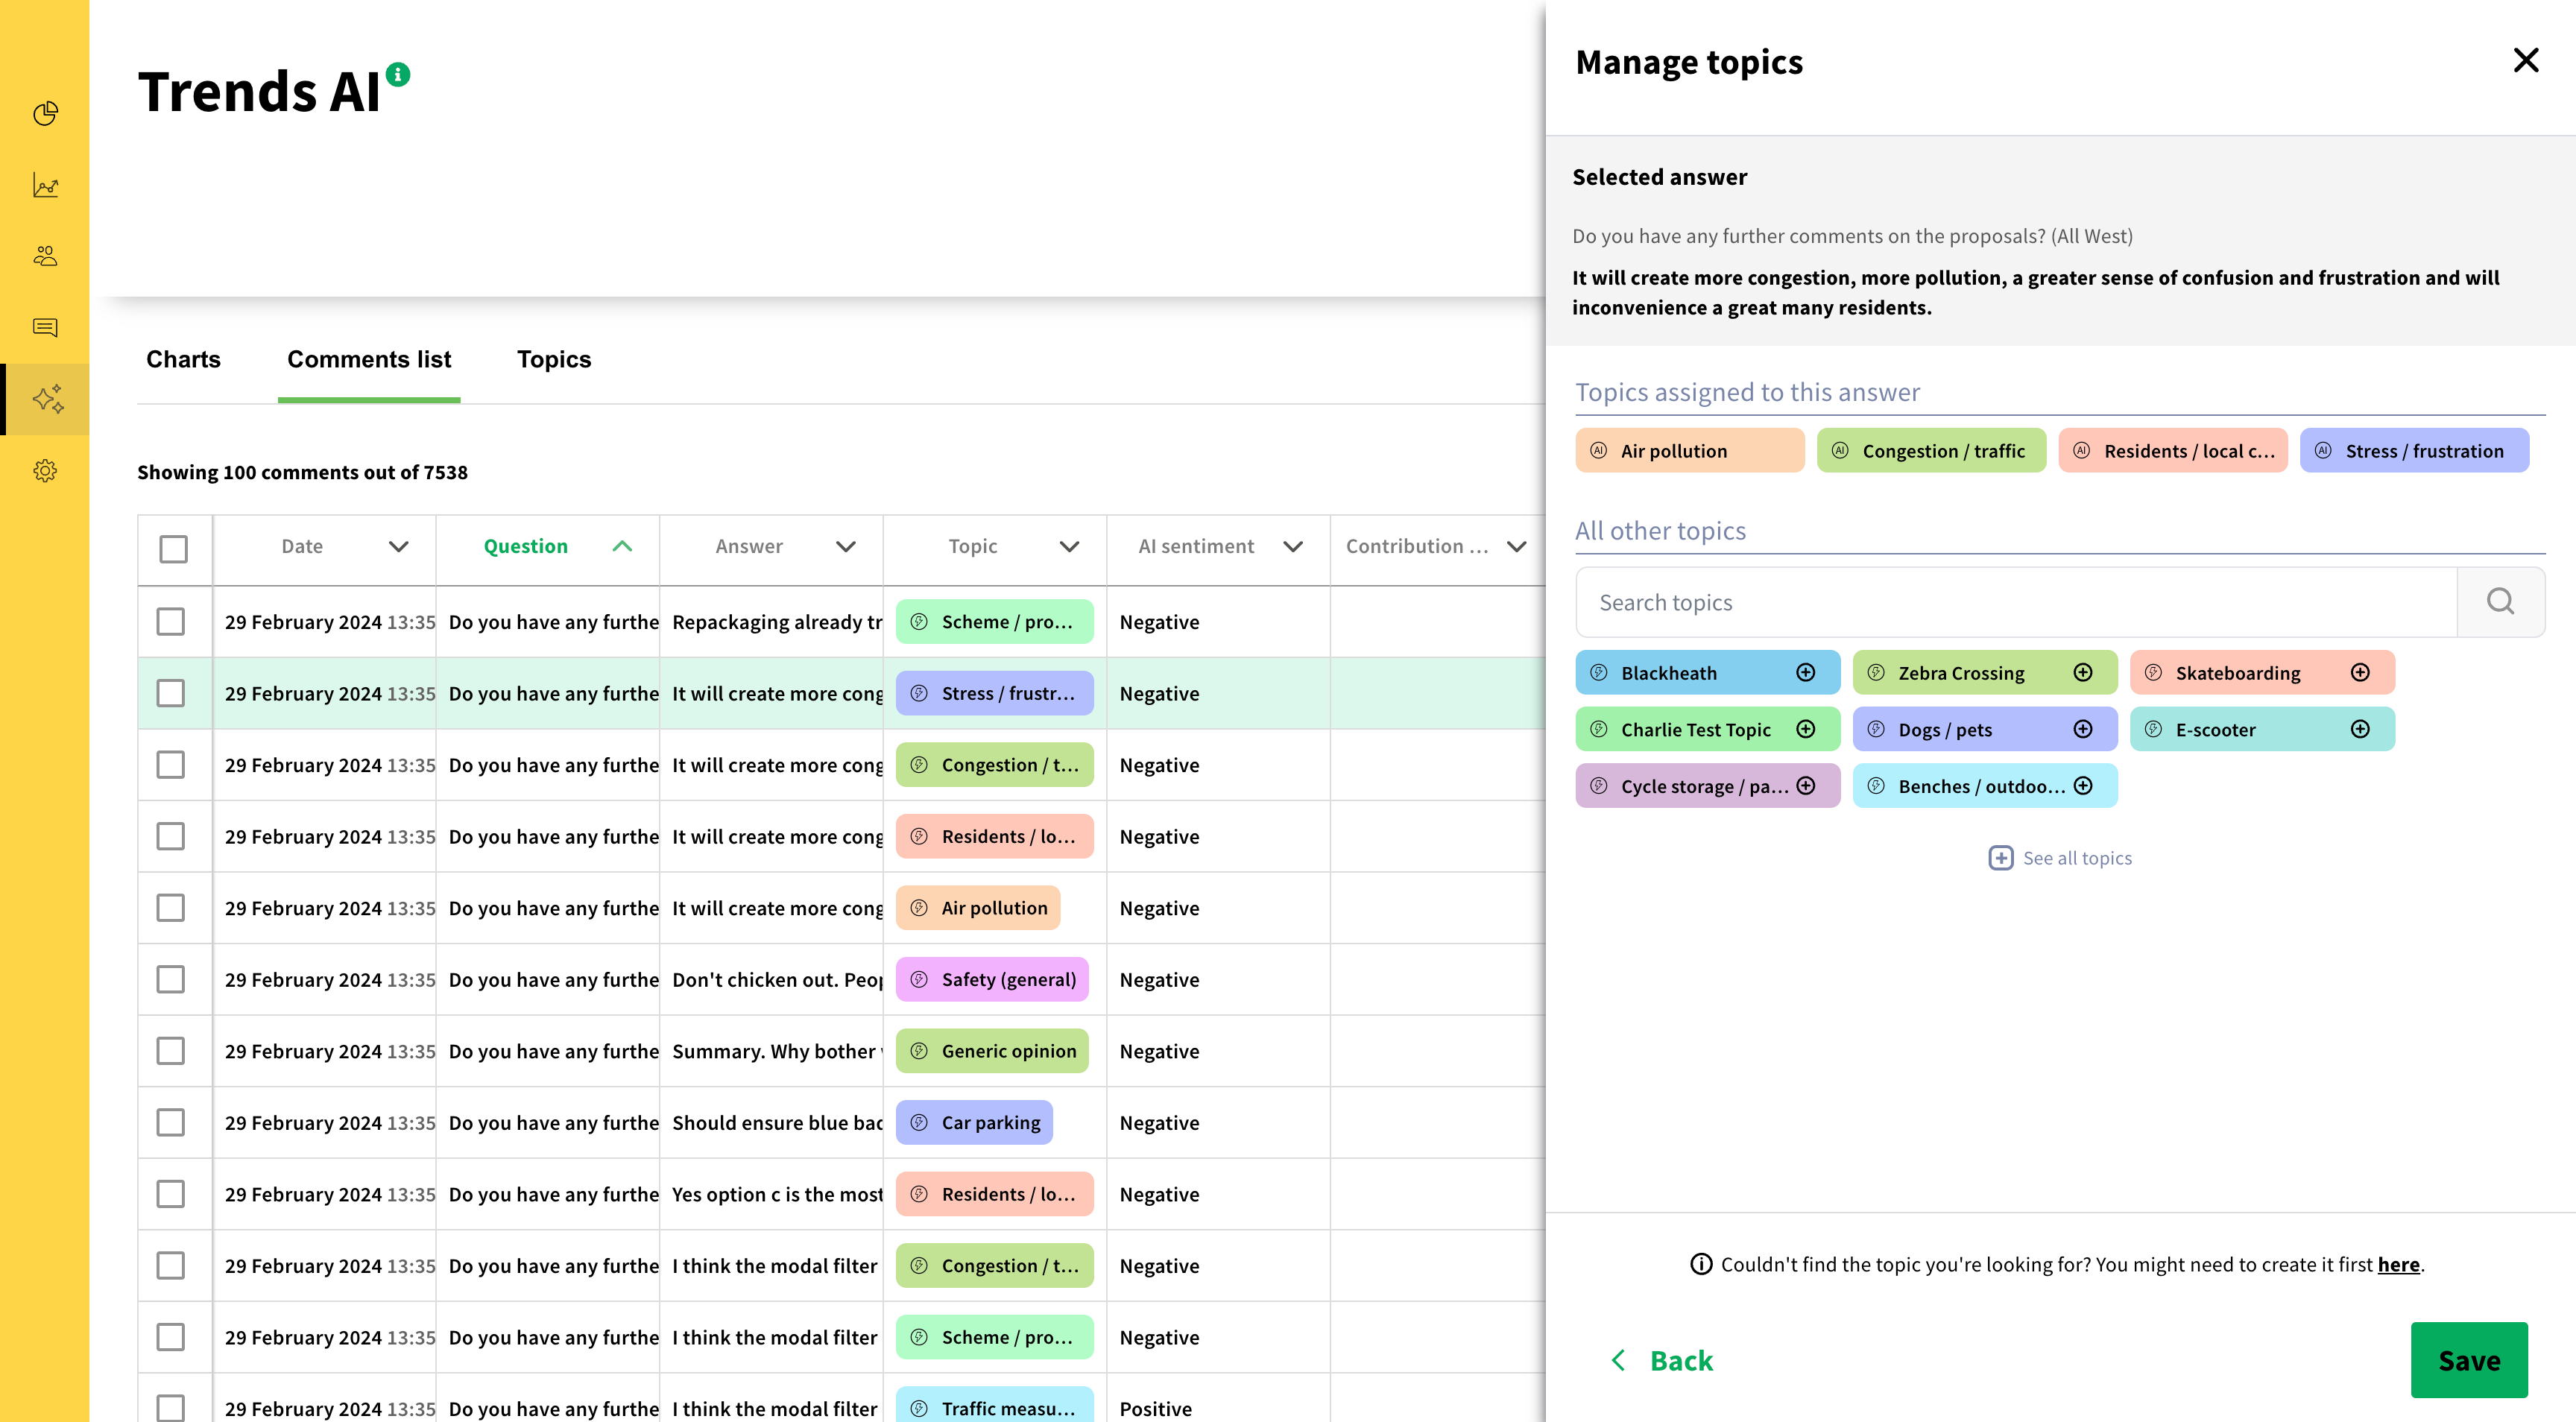
Click on a row in the table to open that particular comment in the side panel. From here, you can see the following:
A list of all topics assigned to this specific comment - along with the AI's view of whether that topic was mentioned in a positive, negative or neutral context.
Responses to other, non-free text survey questions from the same contribution. This helps to provide extra context around that respondent's viewpoint.
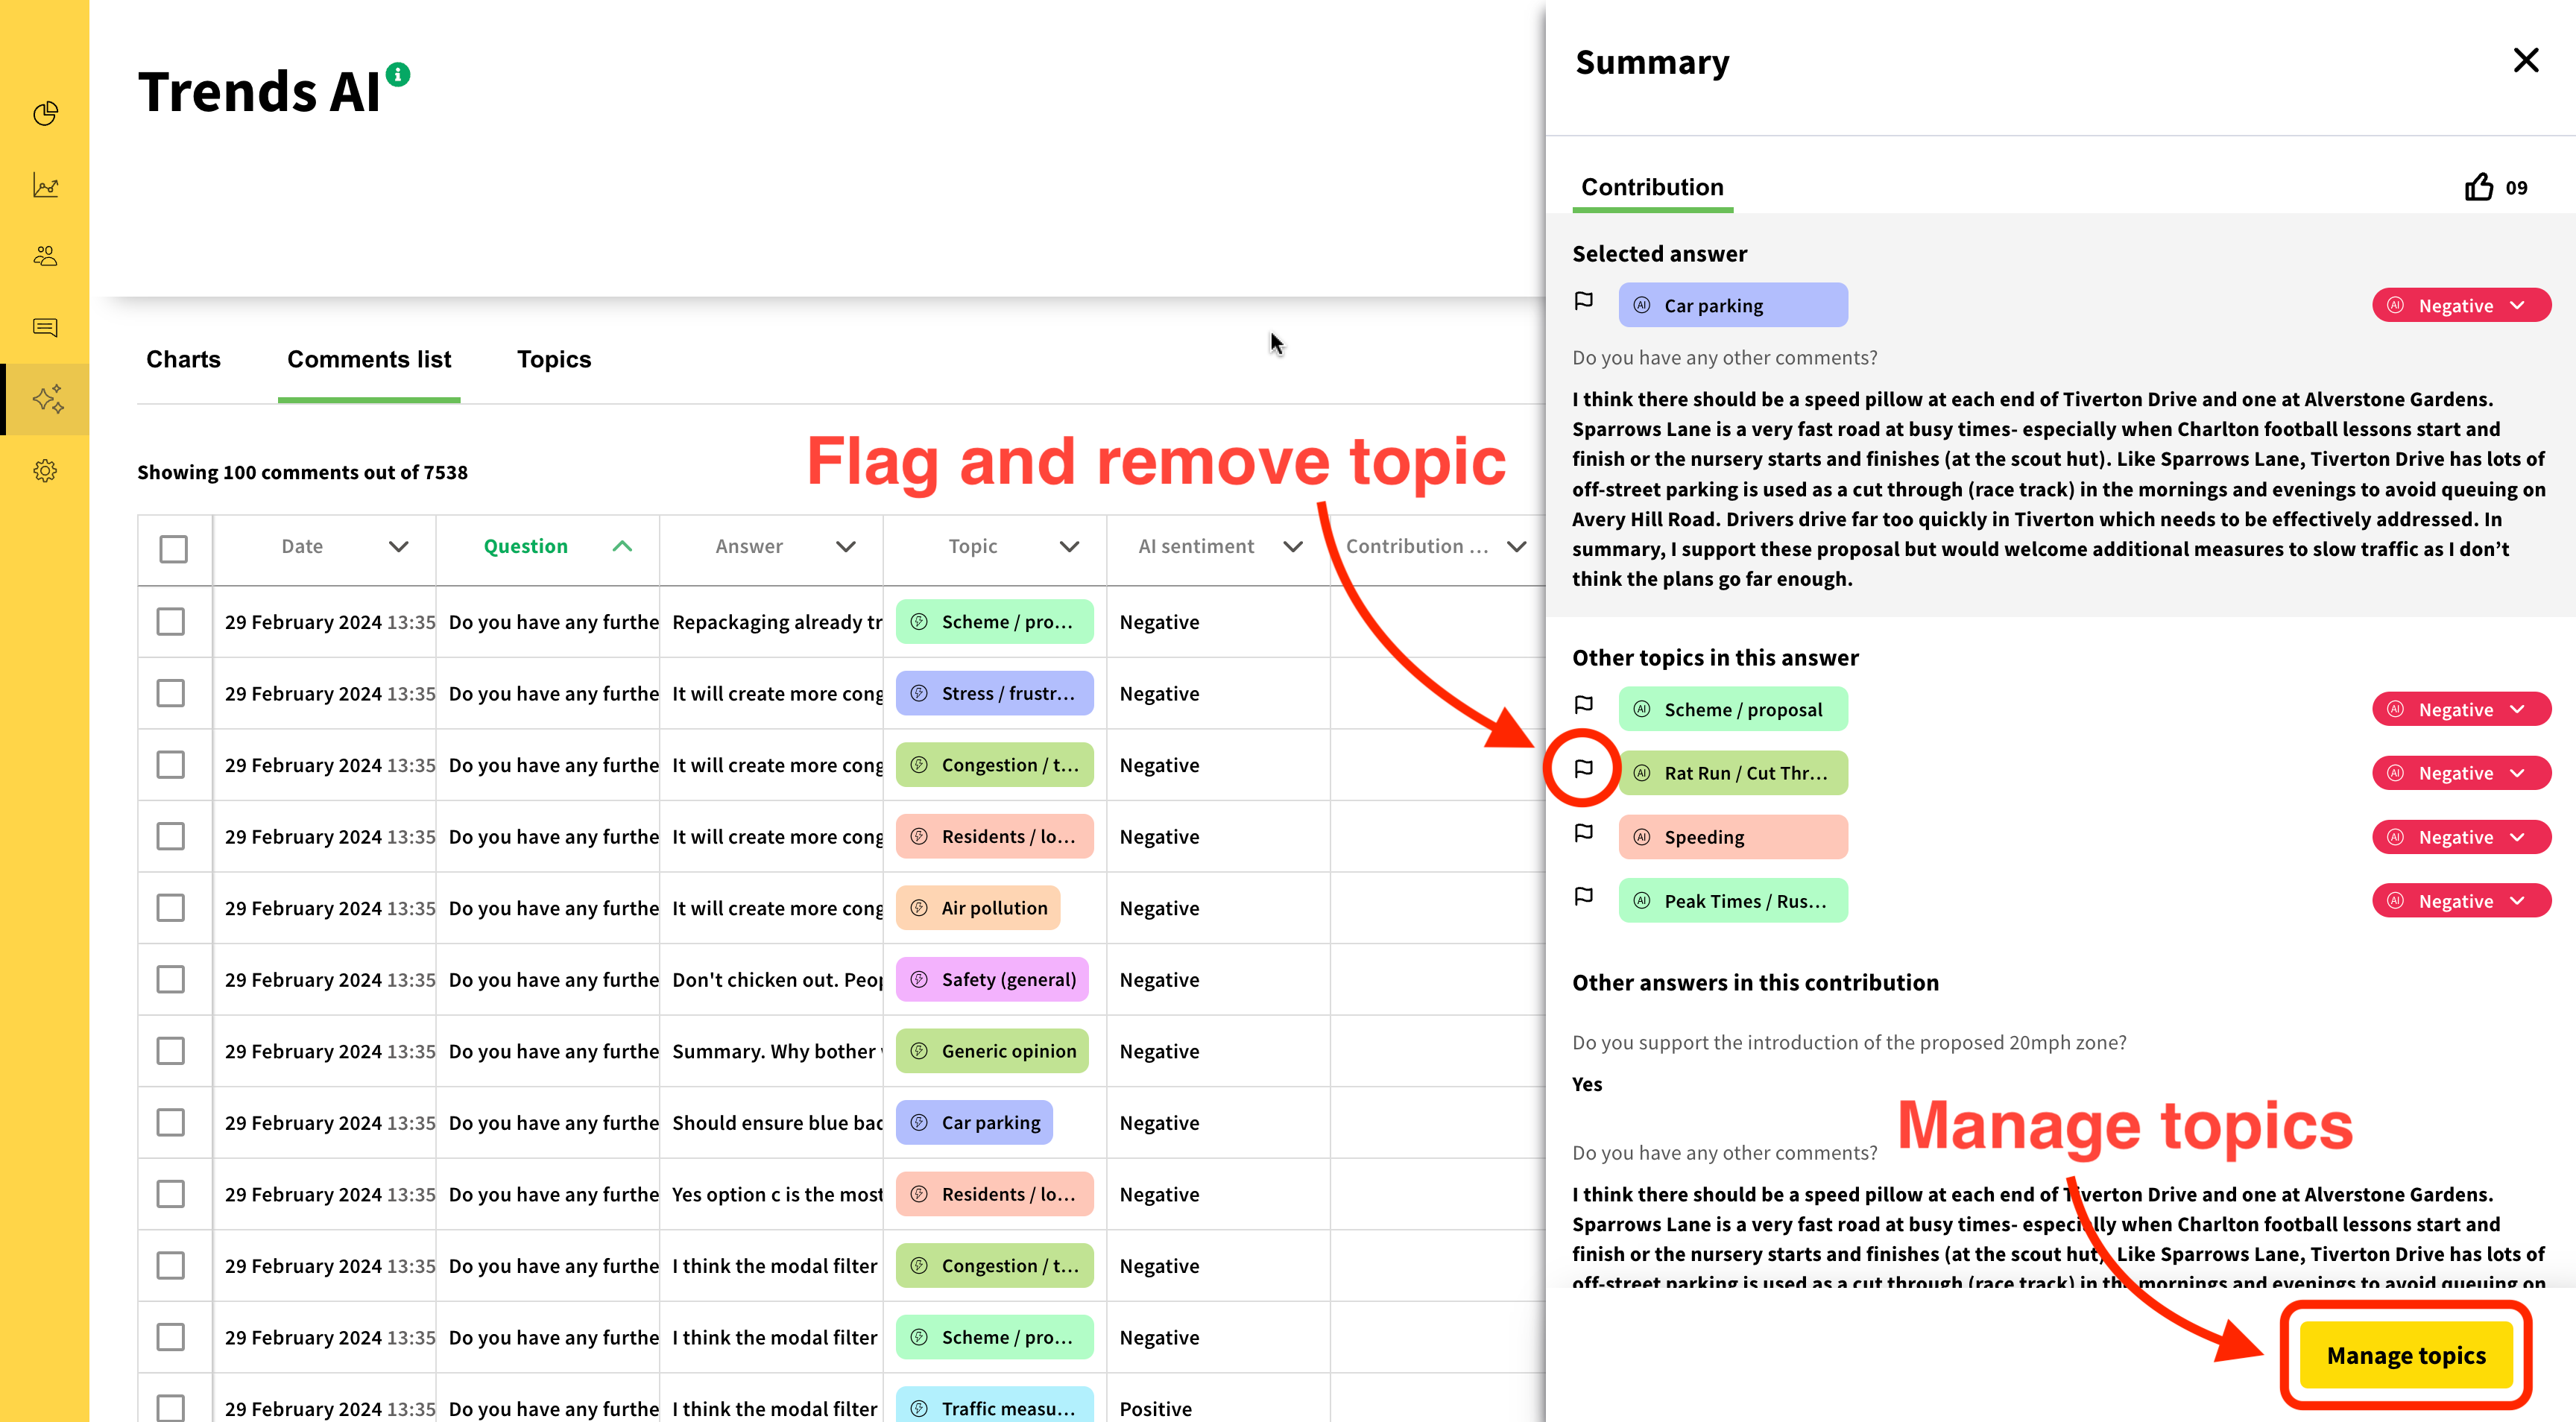
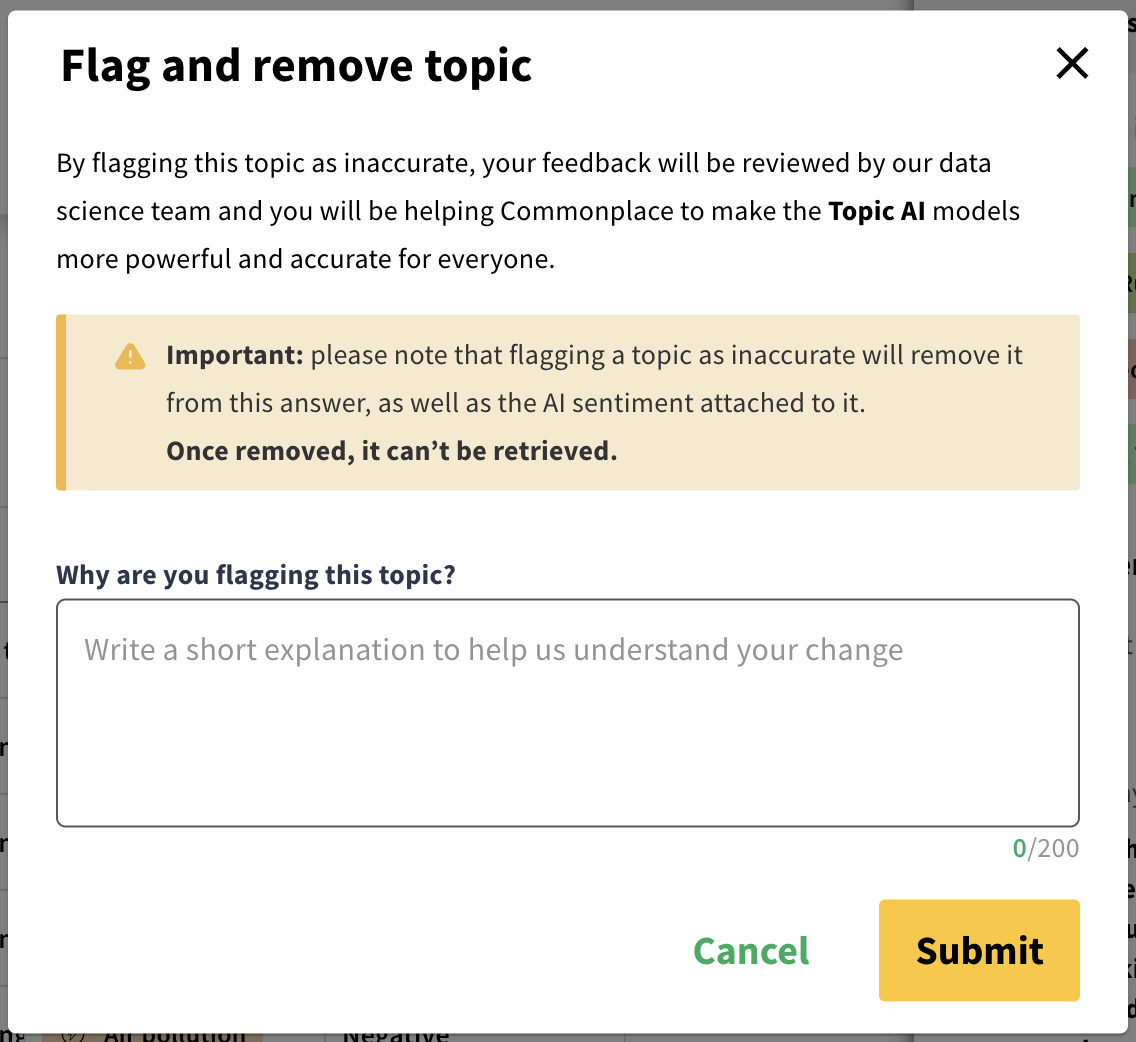
If you believe the AI has got it wrong and assigned a topic to a comment incorrectly, you can remove the topic by clicking the 'flag' icon next to it. You will be asked to provide an explanation of why you feel the topic is inaccurate - this explanation helps us to improve the model's accuracy.
Conversely, if there's a topic that the TrendsAI model hasn't assigned to a comment that you think should be included, click the 'Manage topics' button. Click 'See all topics' to view a full list of topics, or type in the 'Search topics' field to filter. Select a topic to assign to the comment by clicking the '+' button next to the topic name.
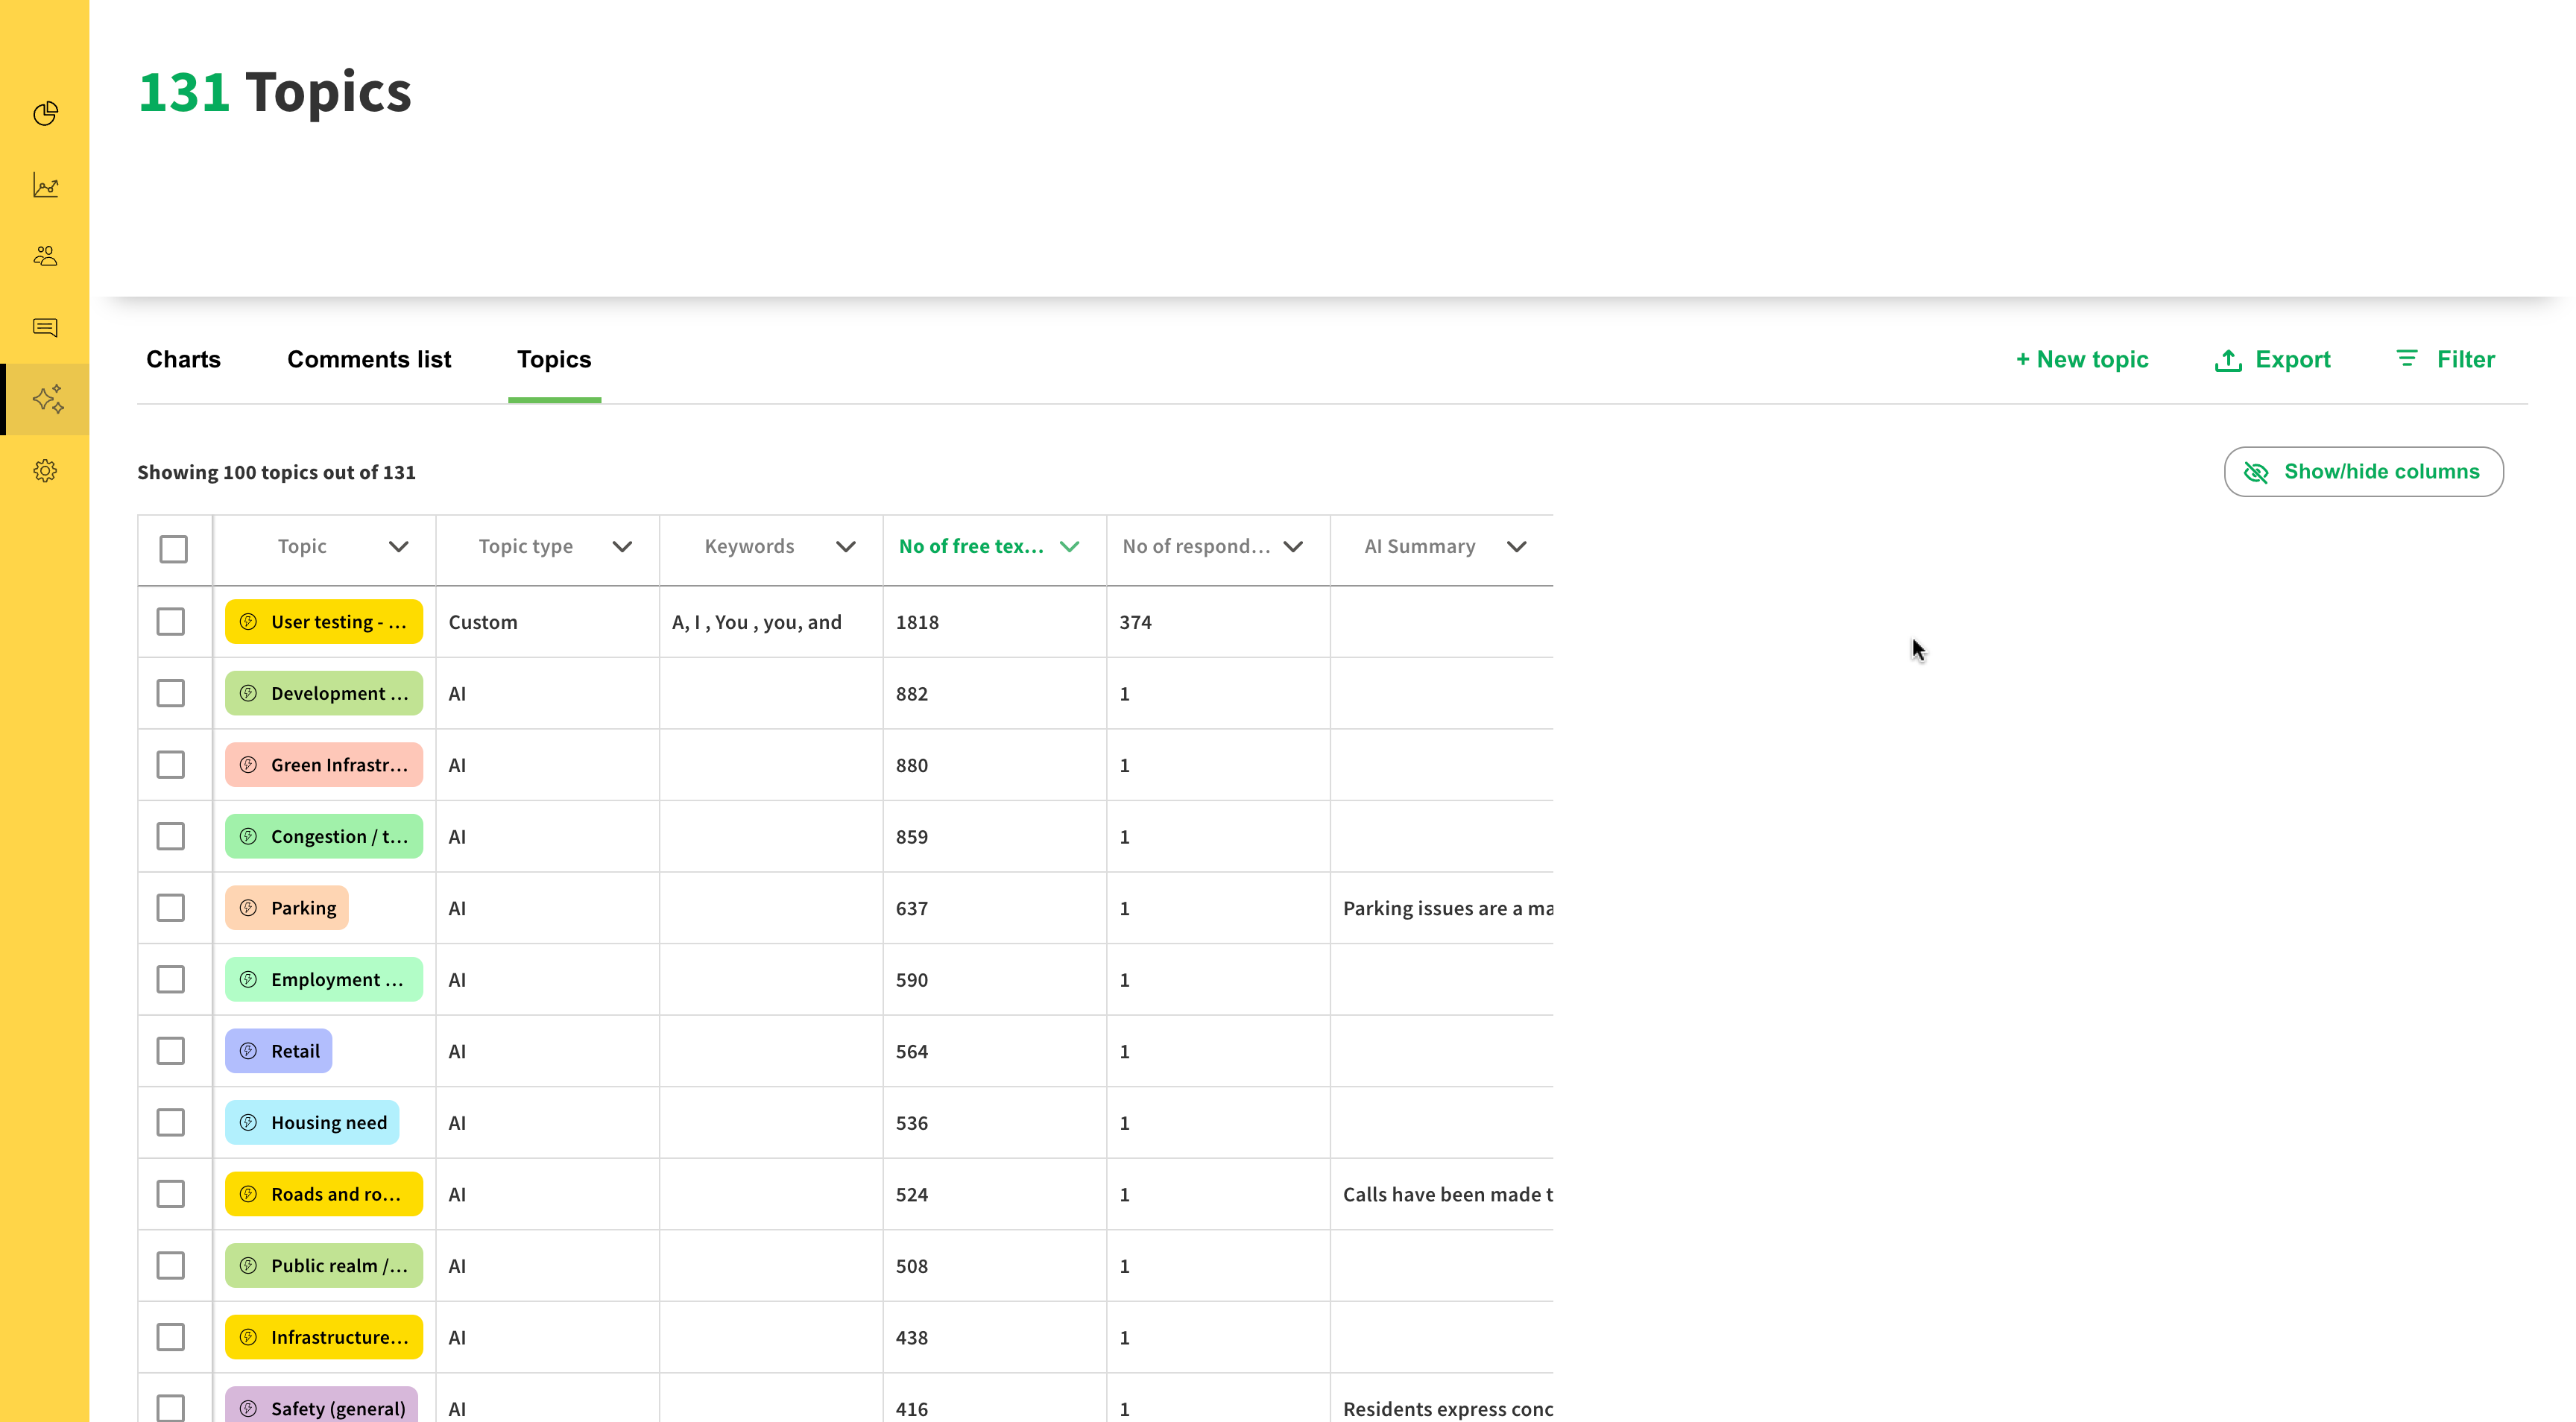
Above: An example of the topics section
The topics section looks at the same topics we saw in the comments list, but this time organised by topic rather than by comment.
The topics section contains the following columns:
Topic
The name of the topic.
Topic type
Whether the topic was created by the TrendsAI model (labelled AI), or by a human (labelled Custom).
Keywords
For custom topics, the keywords associated with this topic are shown here. See below for more information about custom topics.
No. of free text answers
The number of free text comments that have been tagged with this particular topic.
No. of respondents
The number of individual respondents that mentioned this particular topic.
AI Summary
An overall summary of the recurring themes that appear in comments that have been tagged with this topic. For more information about topic summaries, see below.
As with the comments list, the table in the topics section can be sorted, filtered or exported.
Here are some examples of filters you may want to try:
No. of free text answers
If you'd like to see only the topics which are generating a lot of discussion, try filtering to show only topics where the no. of free text answers is greater than - for example - 100.

Click a row in the table to open that particular topic in the side panel. If a topic has received sufficient responses to produce usable data, a topic summary will appear in this panel.
The topic summary contains an AI-powered summary of the ideas, questions, concerns and opinions raised by respondents in comments tagged by that topic. This summary focuses very specifically on that particular topic, and only uses data from your project.
The summary will also pull out supporting examples and quotes from respondents, making it easy to insert this summary into a report.
If you'd like to view a list of the comments that have been tagged with this topic, click 'See answers' - this will take you to the comments list section, filtered to show only comments tagged with that topic.
Topic summaries are not available for custom topics - only topics generated by the TrendsAI model can have AI-powered summaries.
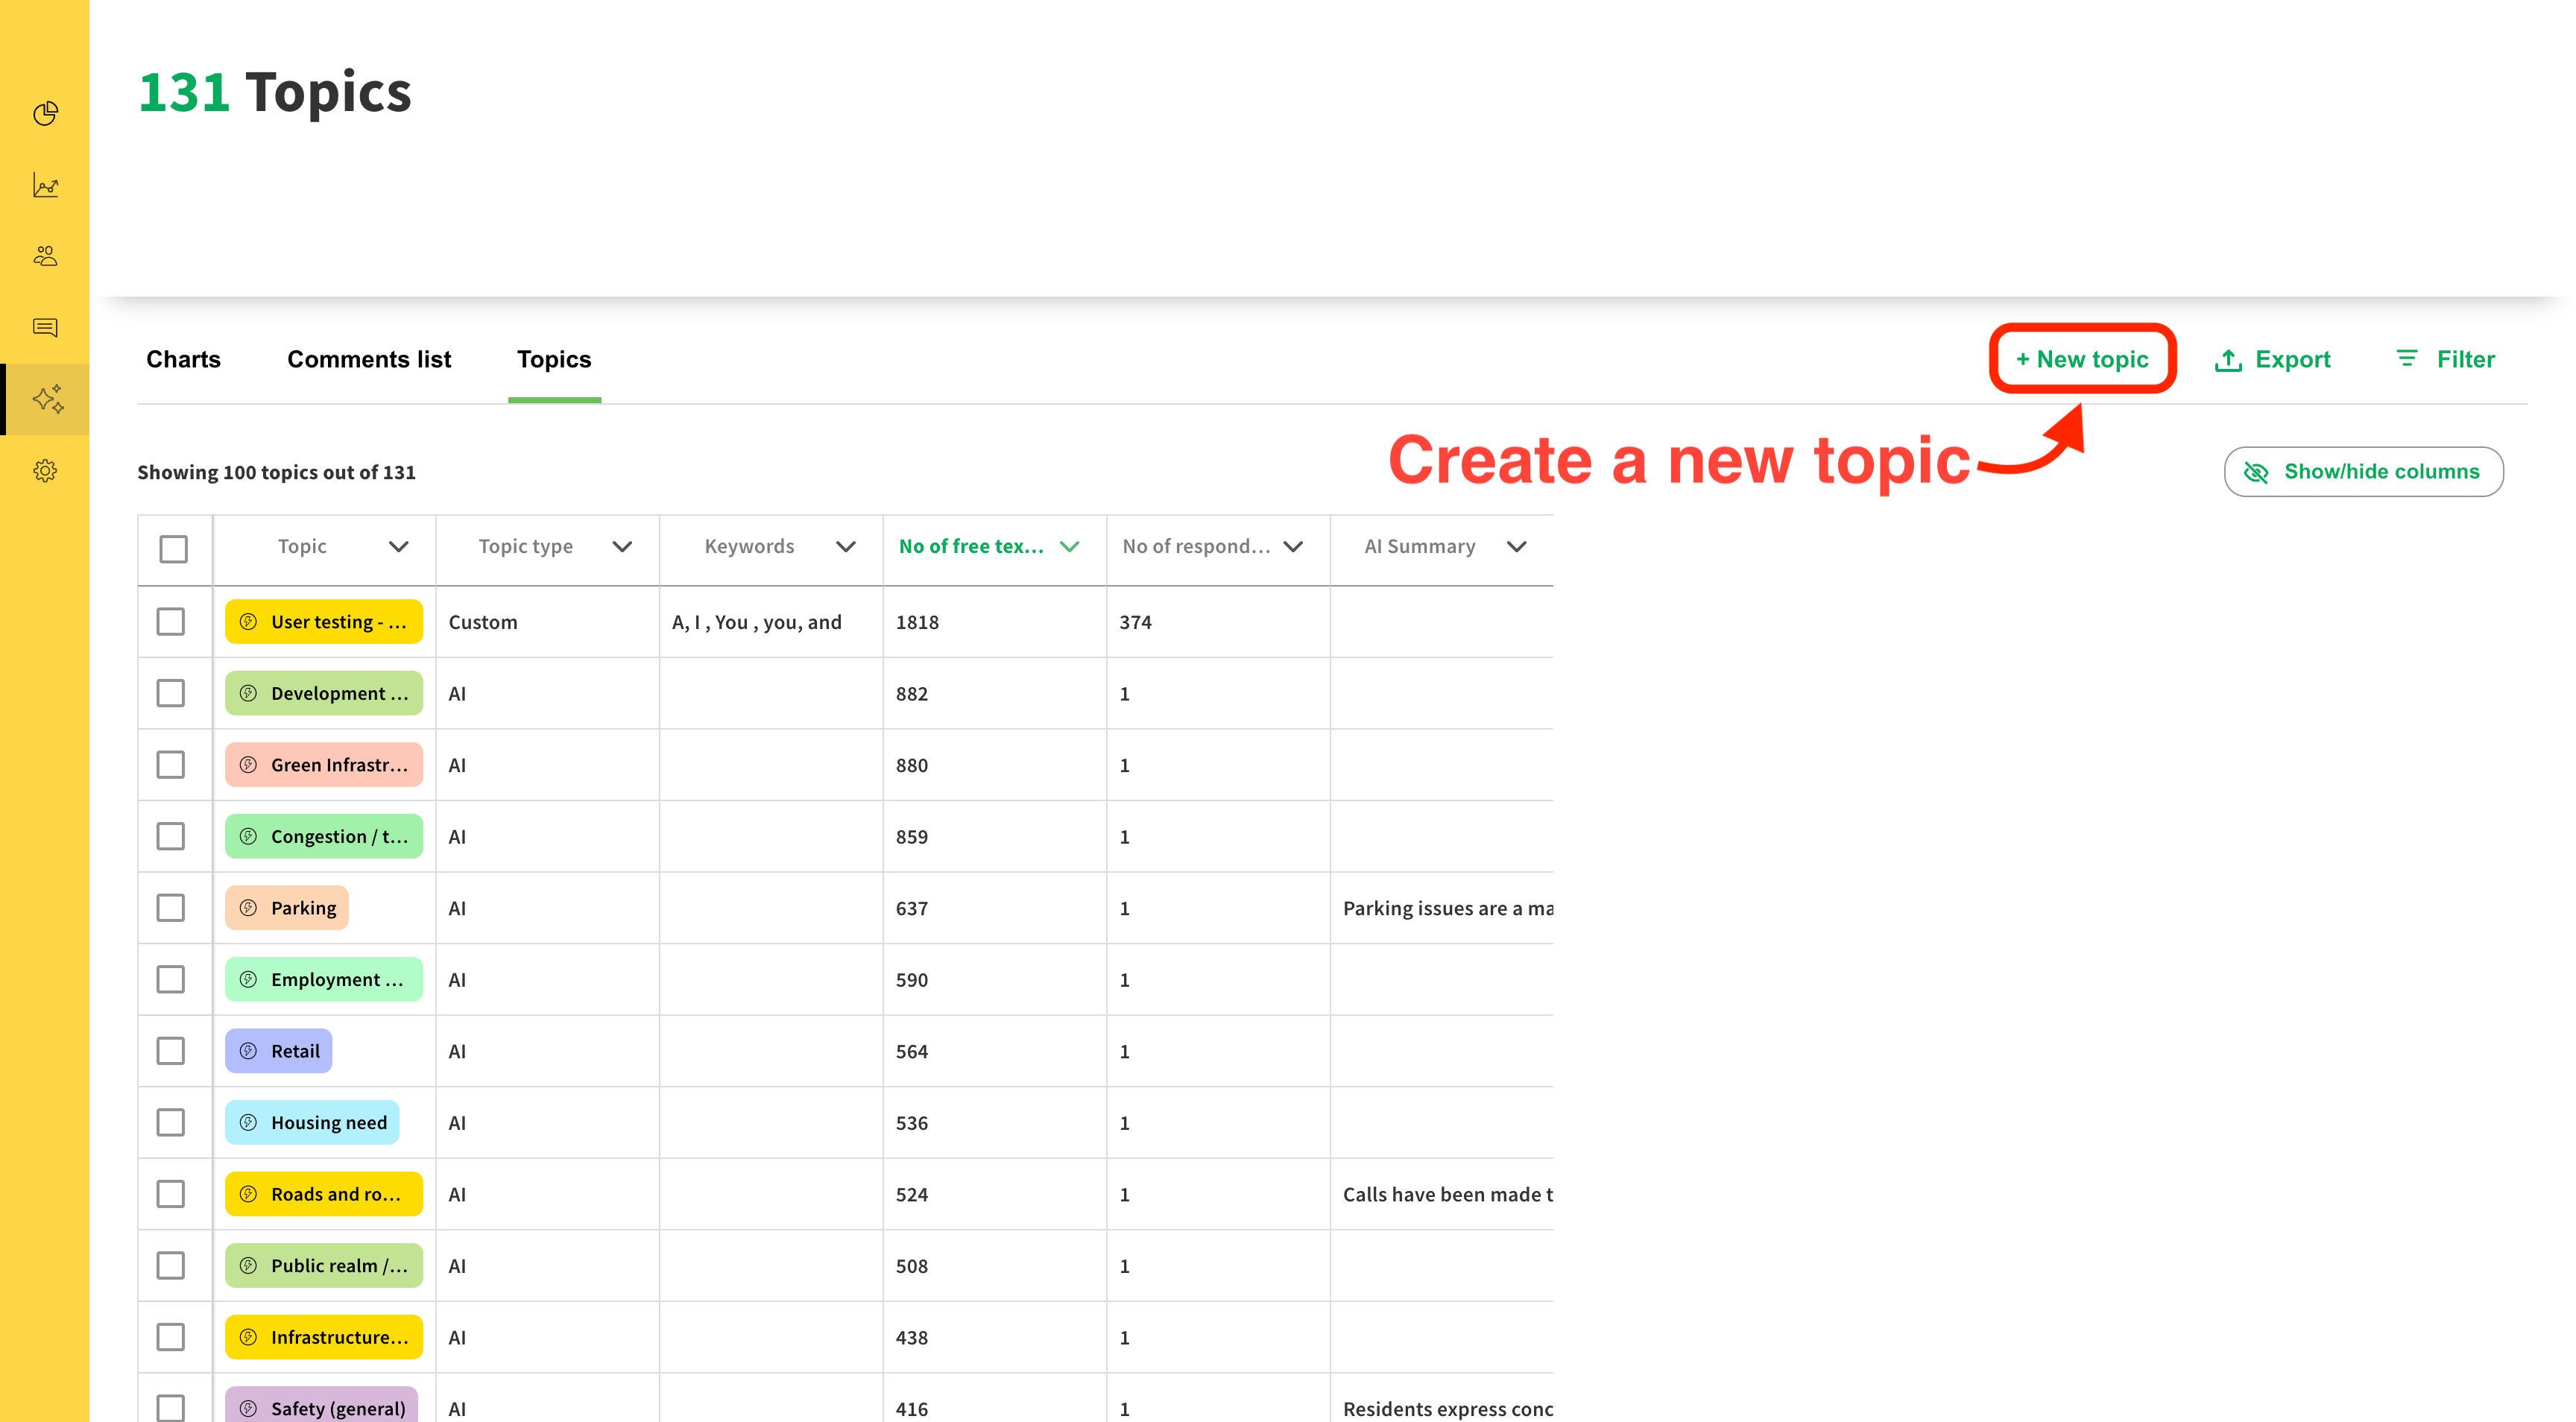
Sometimes you may want to create your own topics to cover themes that may not have been identified by the TrendsAI model. To do this, click the 'New topic' button.
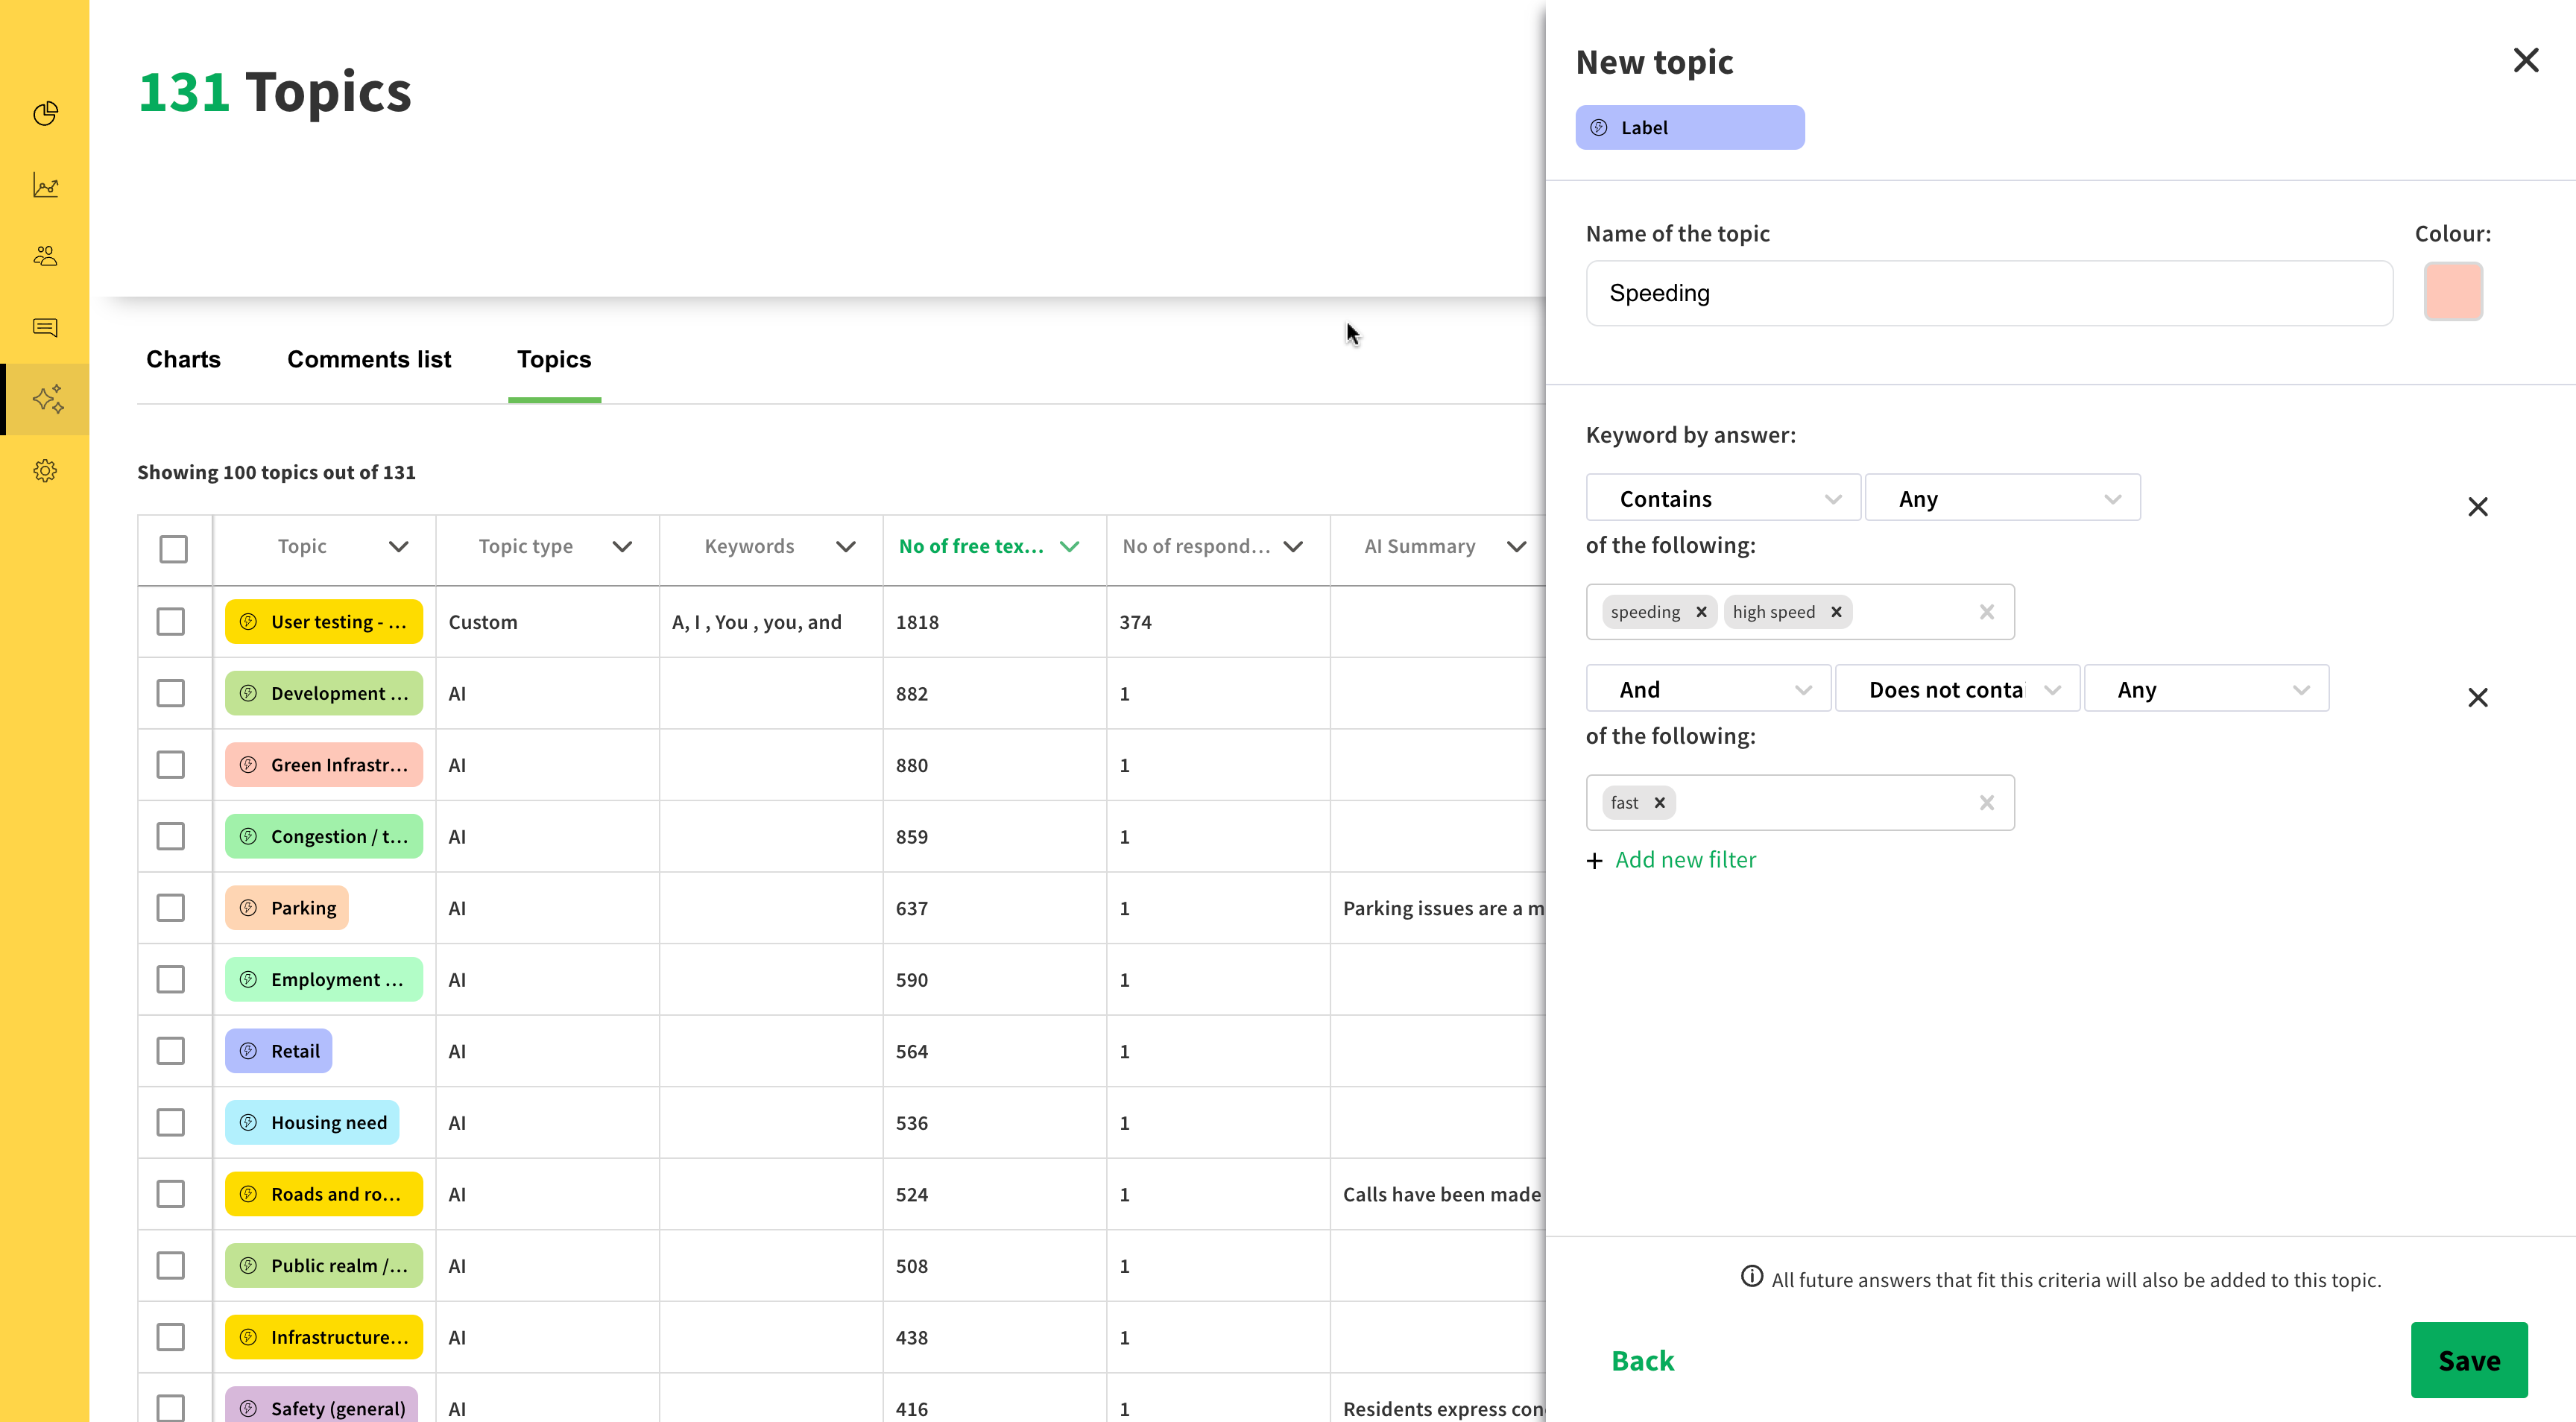
When creating a new topic, you can define rules around keywords.
Let's imagine a scenario where your project is about a new development that includes both a tower block and a multi-storey car park.
If you wanted to create a topic about the height of the tower block, you might want to include comments that mention any of the following keywords: 'height', 'massing' or 'storey'. However, you may want to exclude comments that mention both 'multi' and 'storey' together, in order to exclude comments about the multi-storey car park from your topic about building height.
Once you have created your custom topic, you can then start assigning that topic to comments via the comments list section.
To edit a custom topic, click the topic in the table to open the side panel - then click 'Edit topic'.
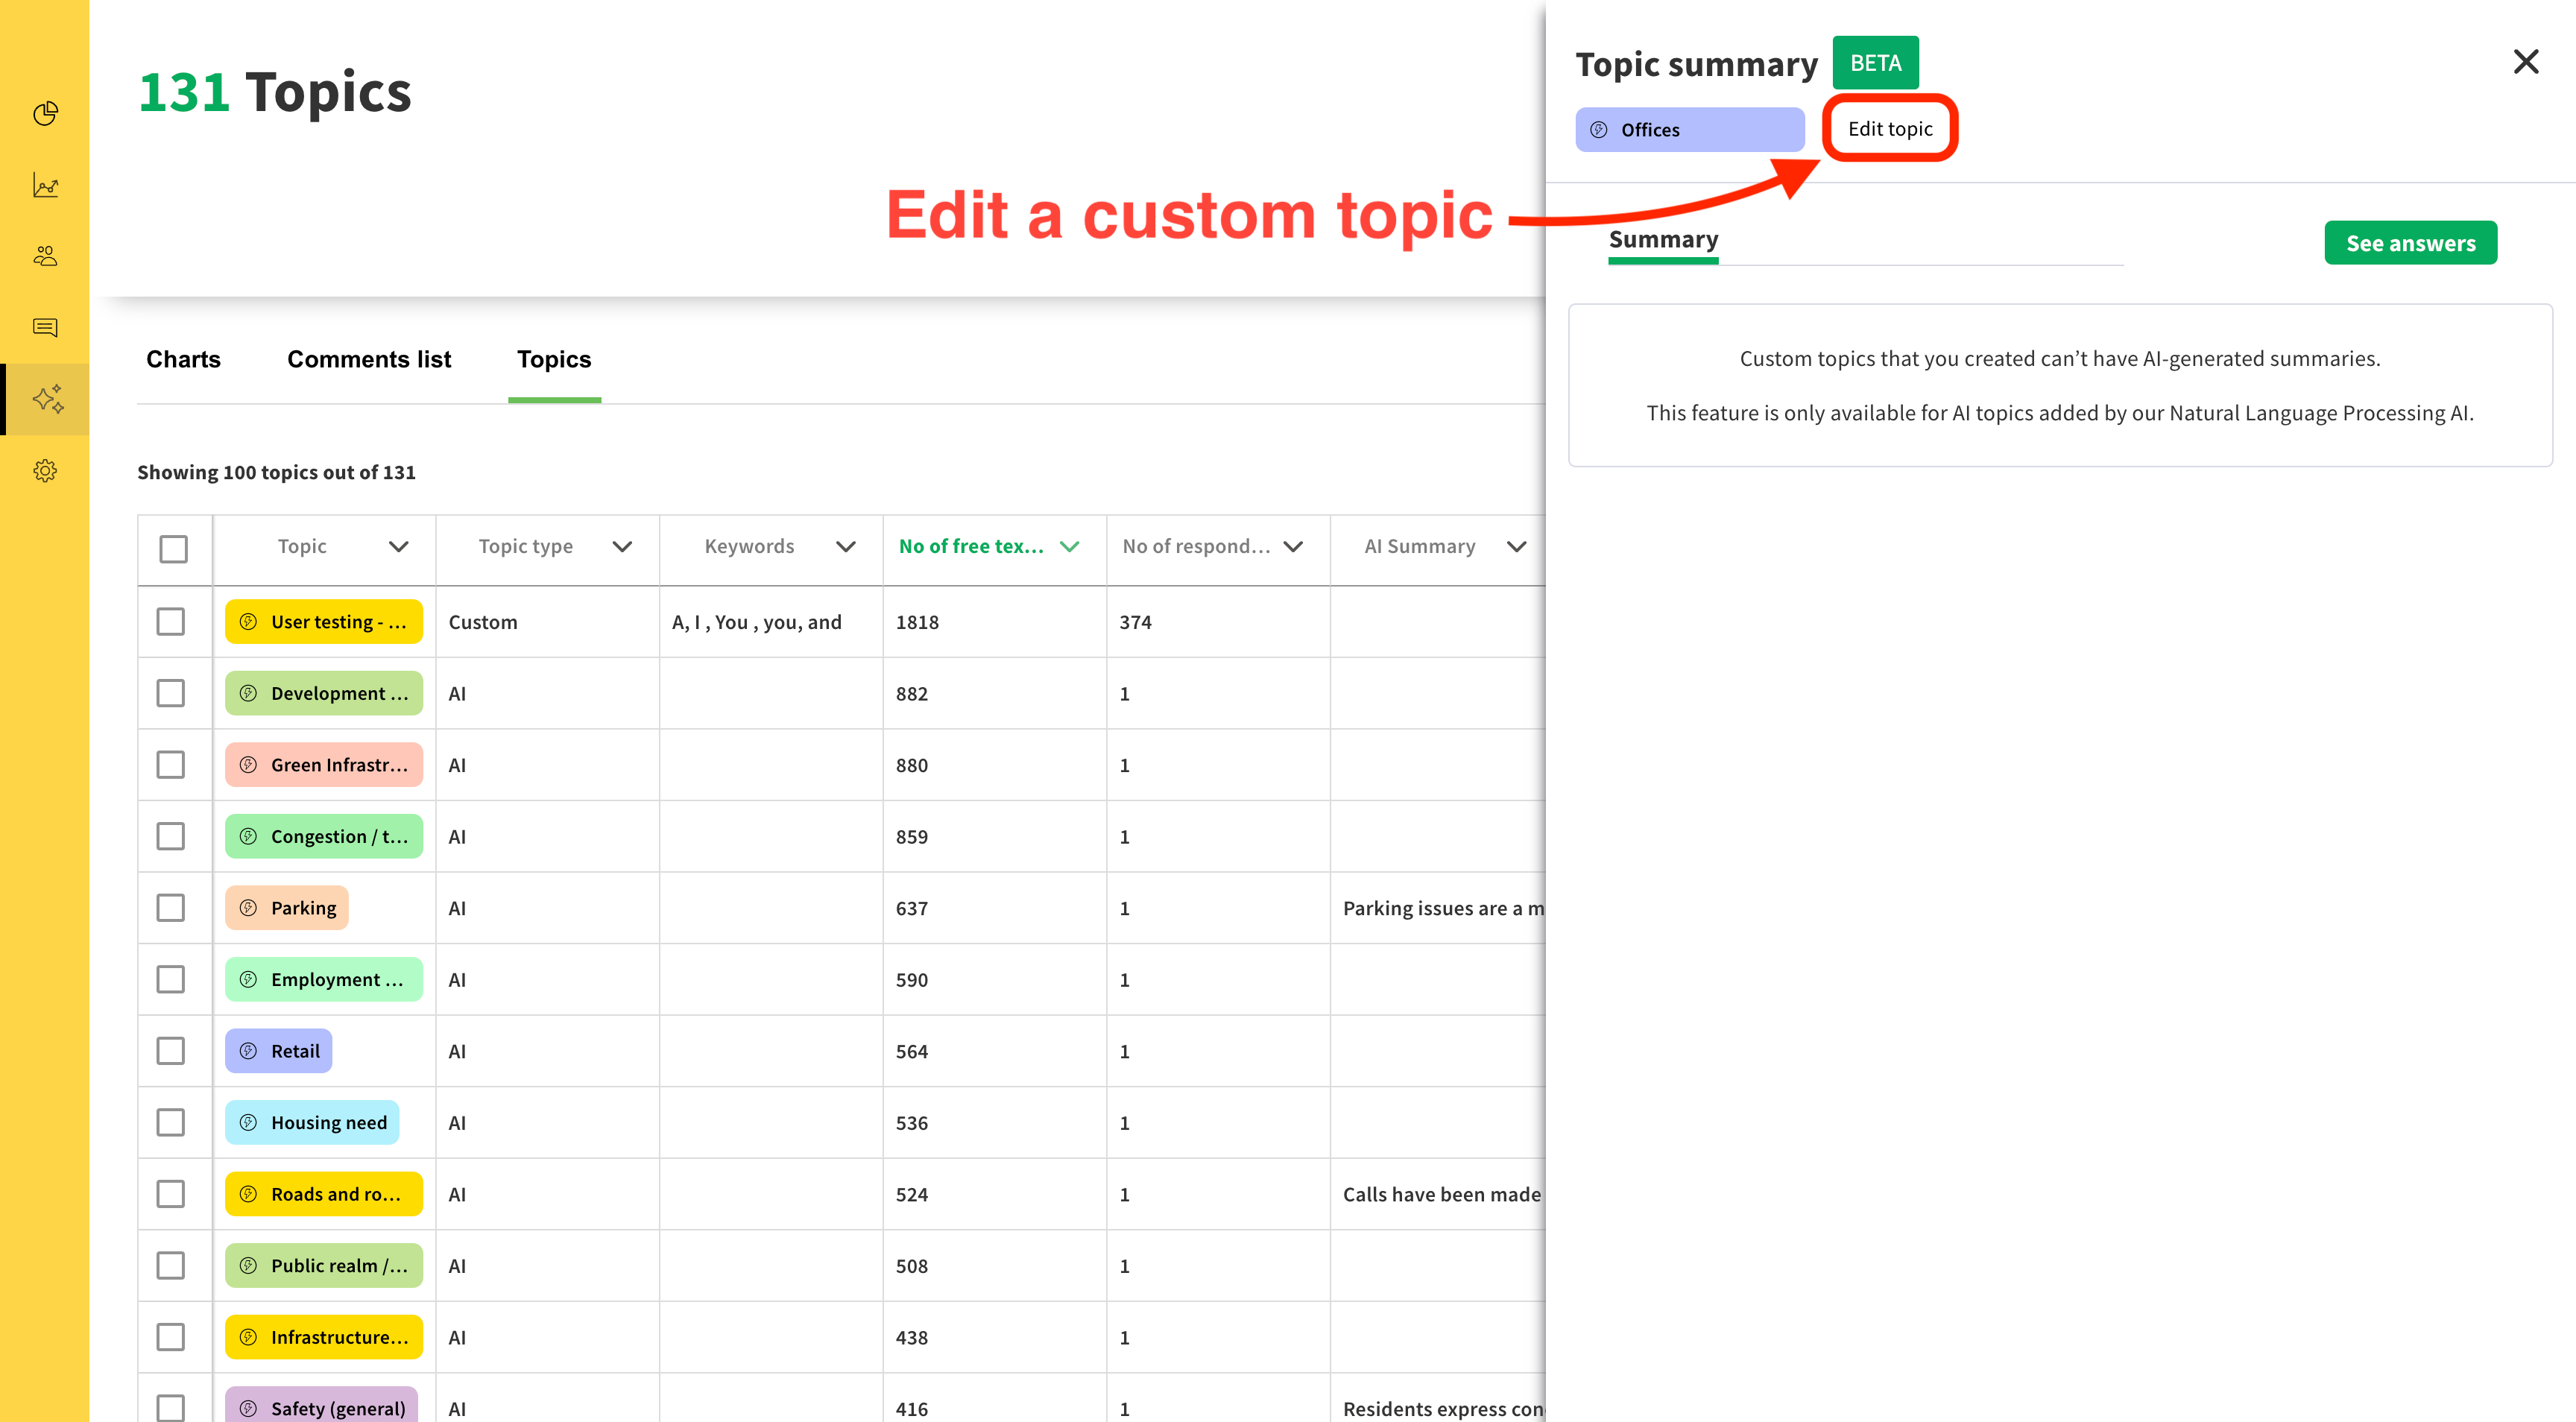
From here you can reconfigure the keyword rules for this topic.
Only custom topics can be edited - topics that have been automatically generated by the TrendsAI model are not editable.
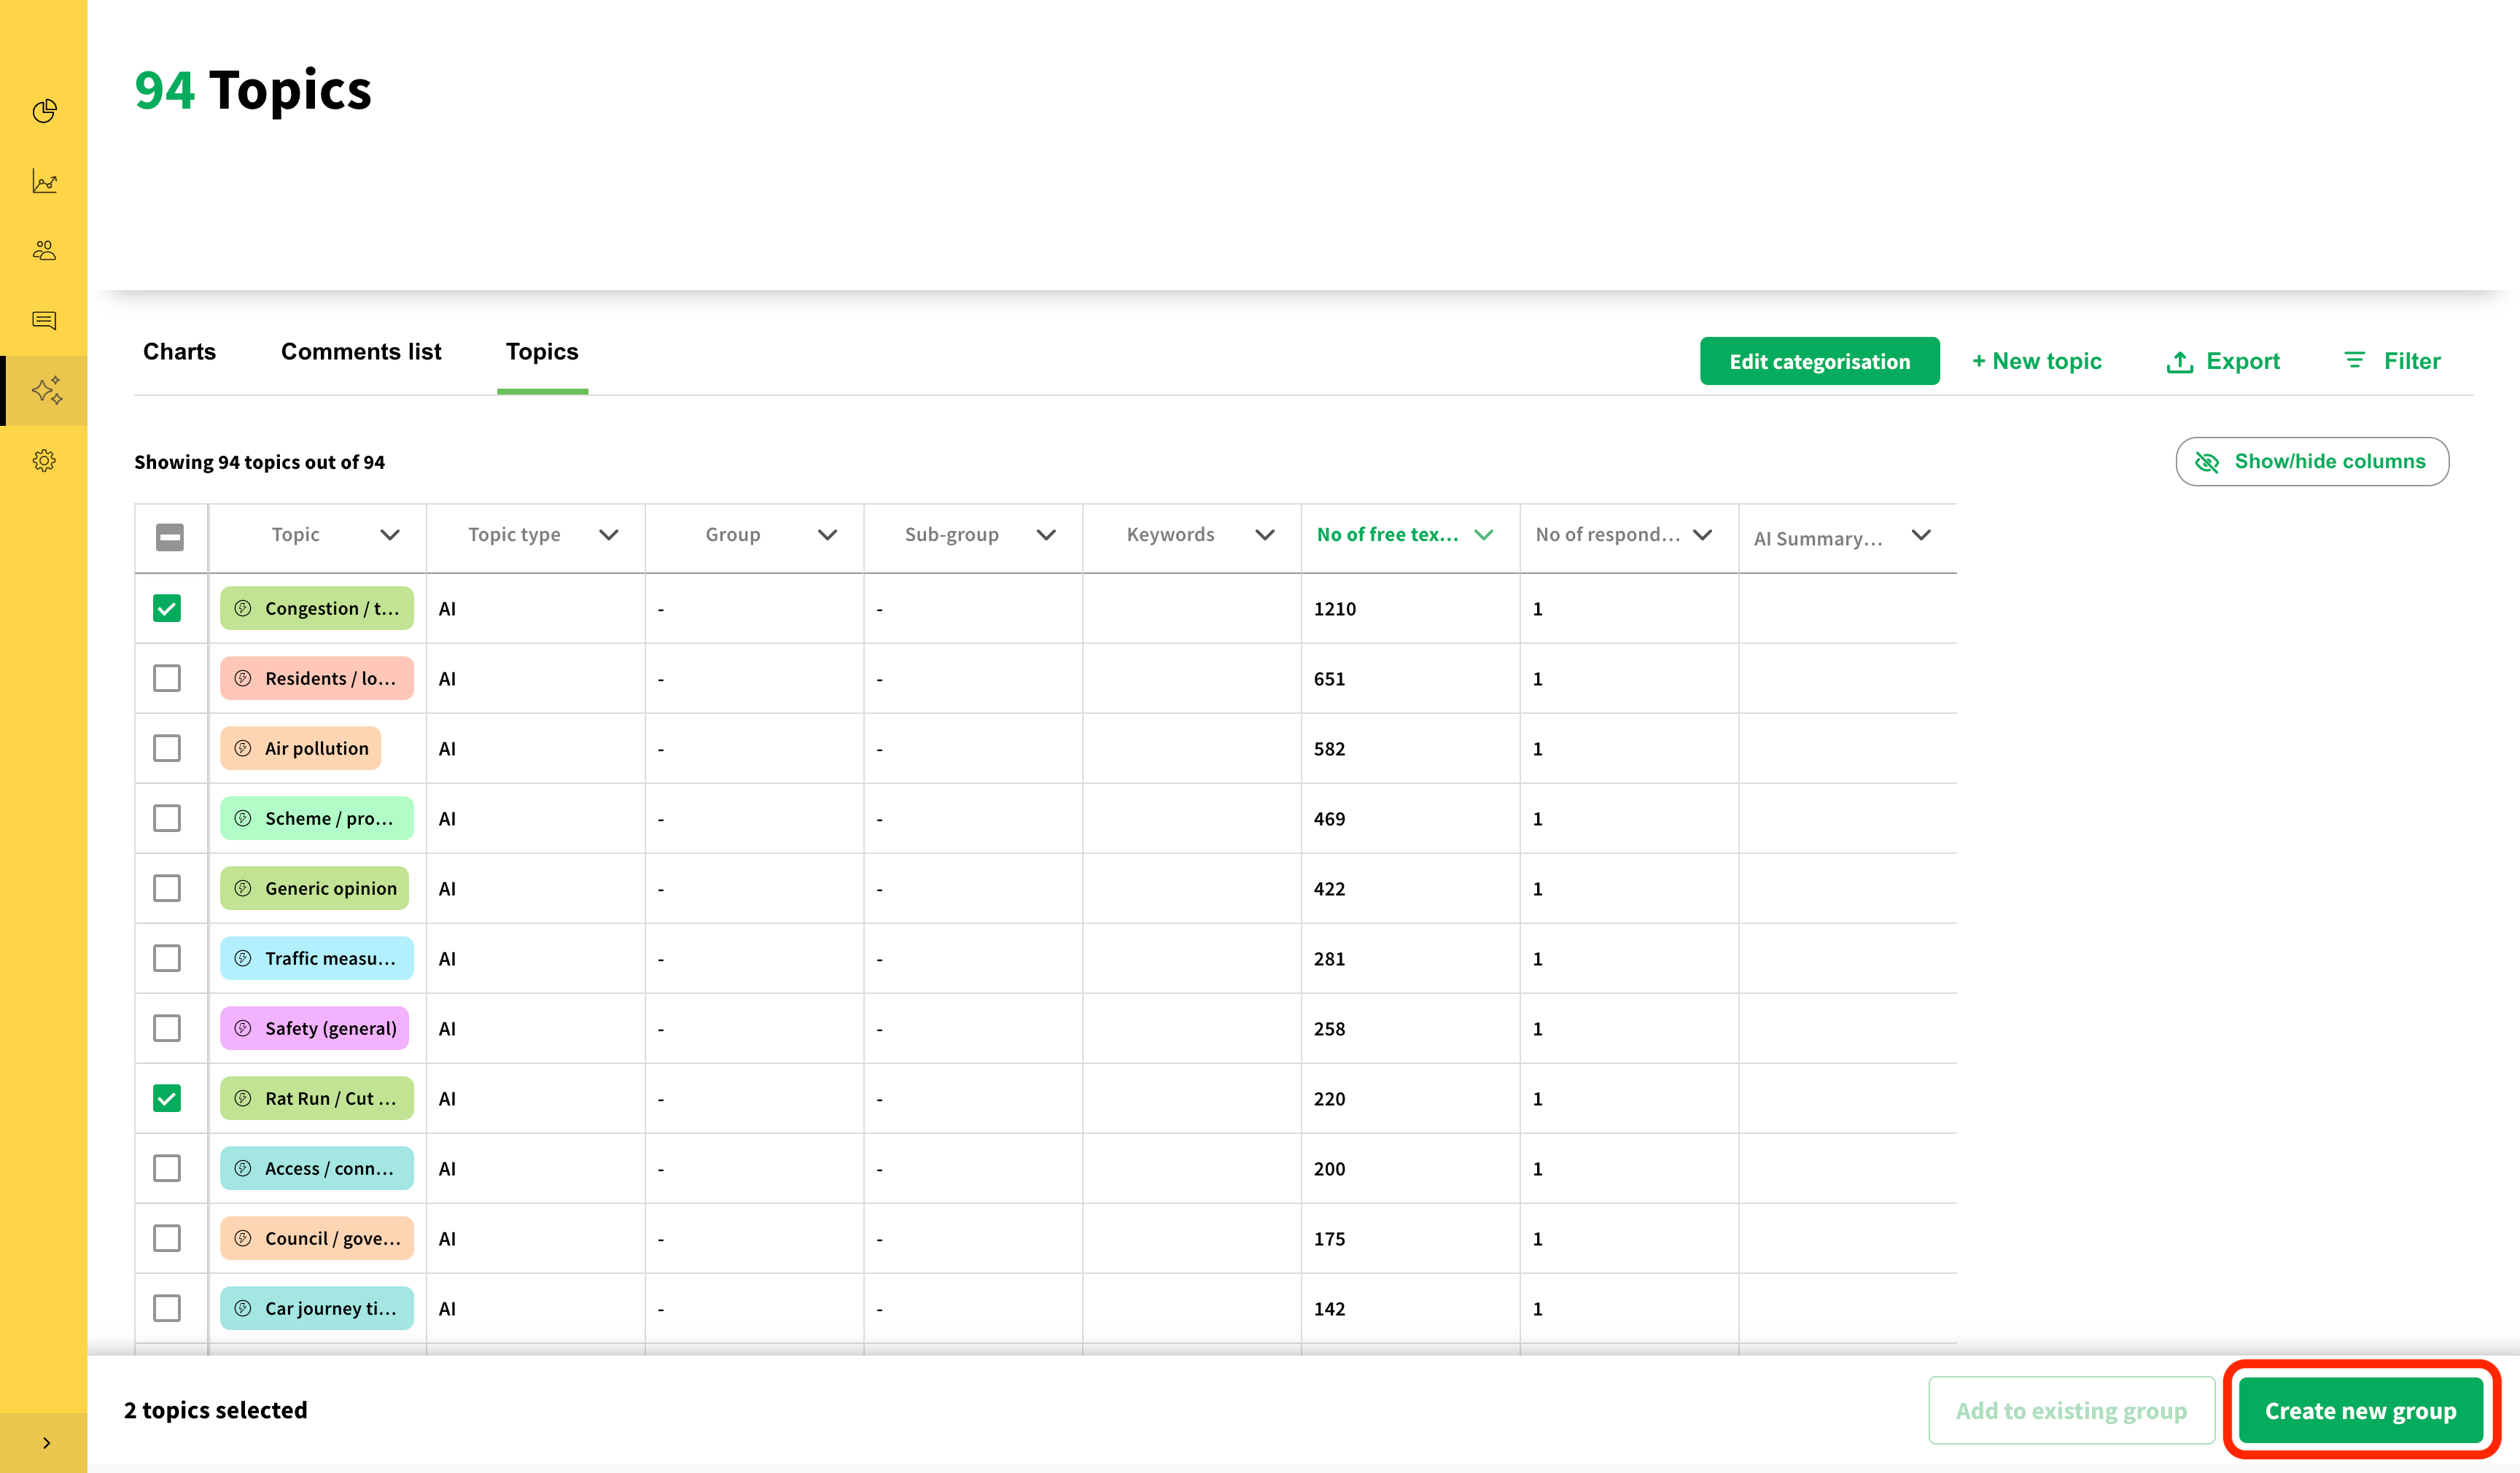
Topics can be grouped in order to aggregate together topics with similar themes. This feature can be switched on by request.
To group topics, select topics in the table that you would like to group together and click 'Create new group'.
After creating a group, you will be asked to name the group and select a colour.
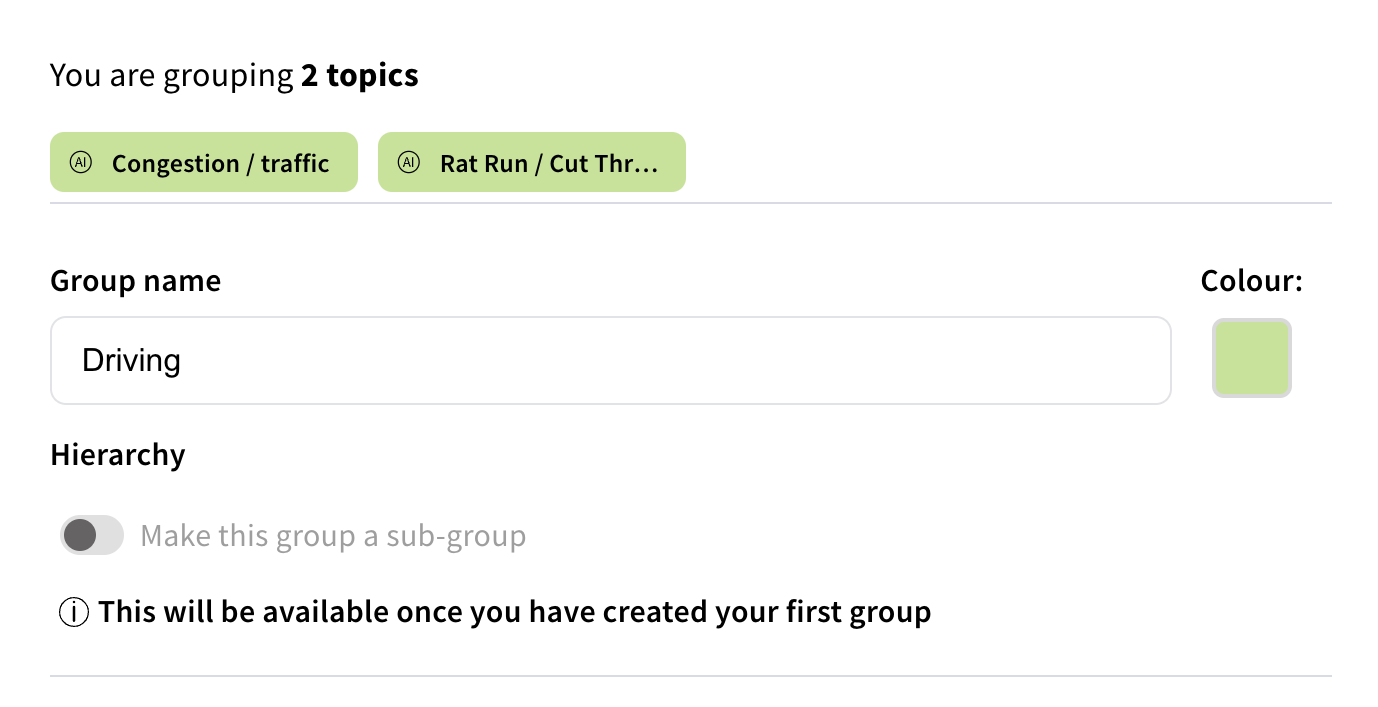
By checking the 'Make this group a sub-group' box, groups can be created as a sub-group of another group - this creates a topic hierarchy. If this is done, a topic hierarchy chart will appear on the charts tab.
Still unsure about anything? There's lots more information here on the Commonplace Help Centre - alternatively, contact the support team and we'll be happy to help 👋