You can now build an engagement report with live, embeddable data charts. These charts can be embedded either within your Commonplace sites, or on any external website that allows embedding.
Using the array of filtering and pivoting options in the dashboard, as well as customisation options built into the chart embed tool, you can create flexible and visually engaging charts.
Unlike a static image, embedded charts show a live snapshot of your project data, allowing your respondents access to a controlled view of the results of your engagement.
A live example of an engagement report can be seen here: https://stevenagecyclehire.commonplace.is/en-GB/proposals/stevenage-cycle-share-scheme-survey-2023/step1.

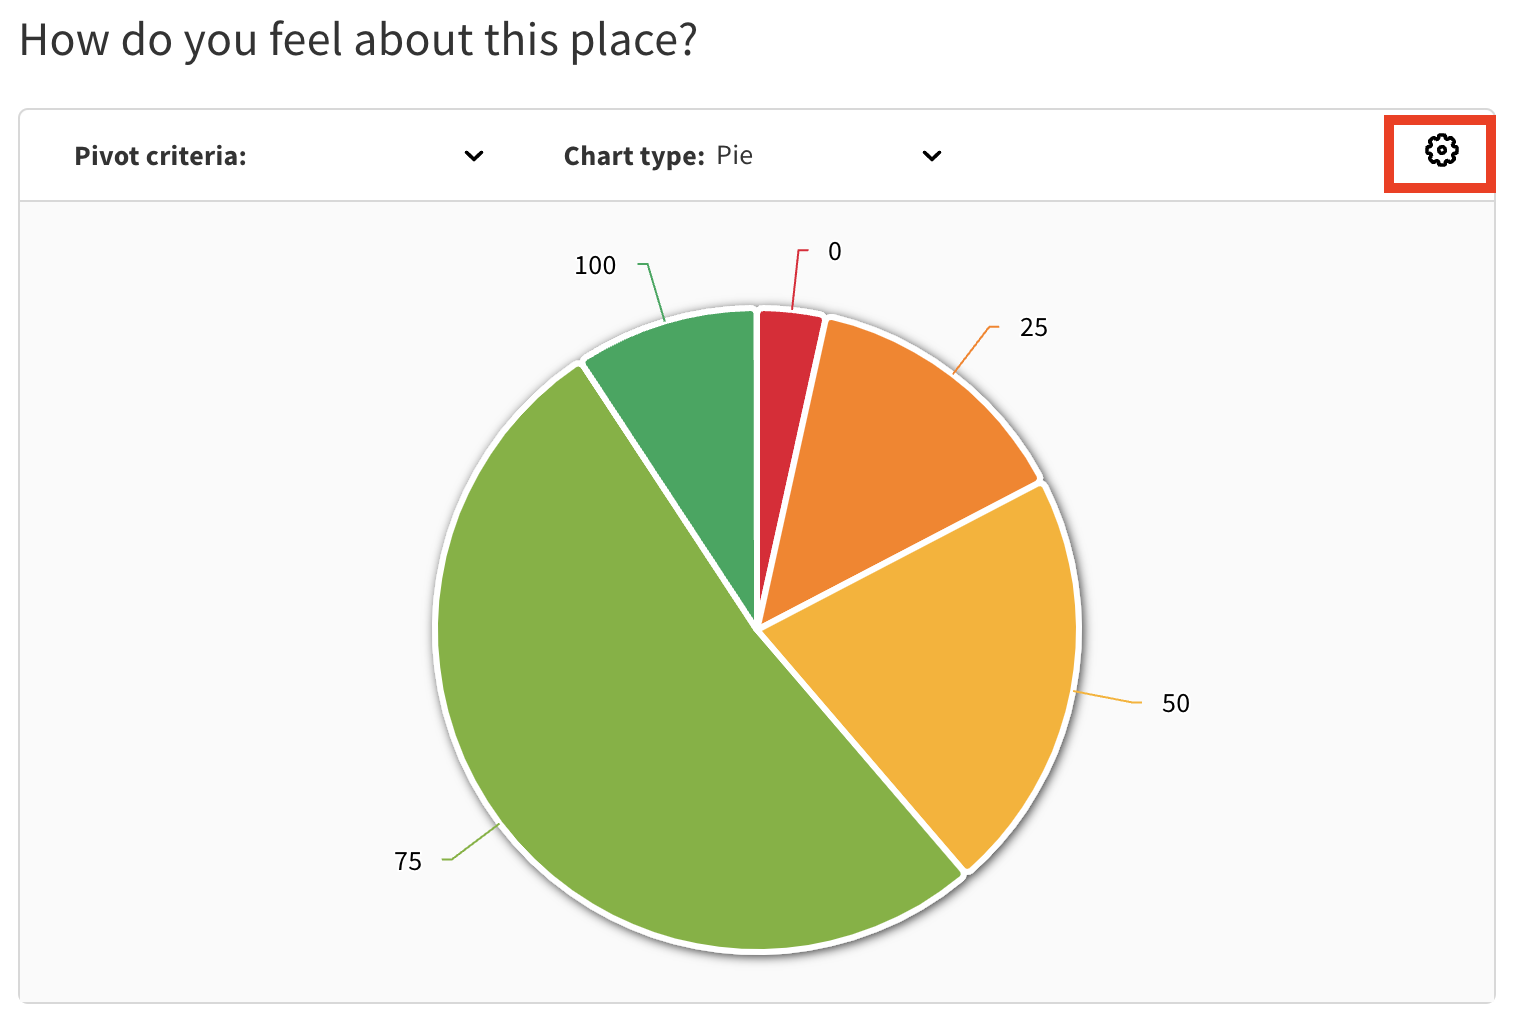
First, go to your project dashboard. Before embedding, you can customise your chart - such as by filtering the dashboard, changing the chart type, or pivoting by another data source. These customisations will automatically be displayed in your embedded chart.
On the chart you want to embed, select the cog icon in the top right hand corner
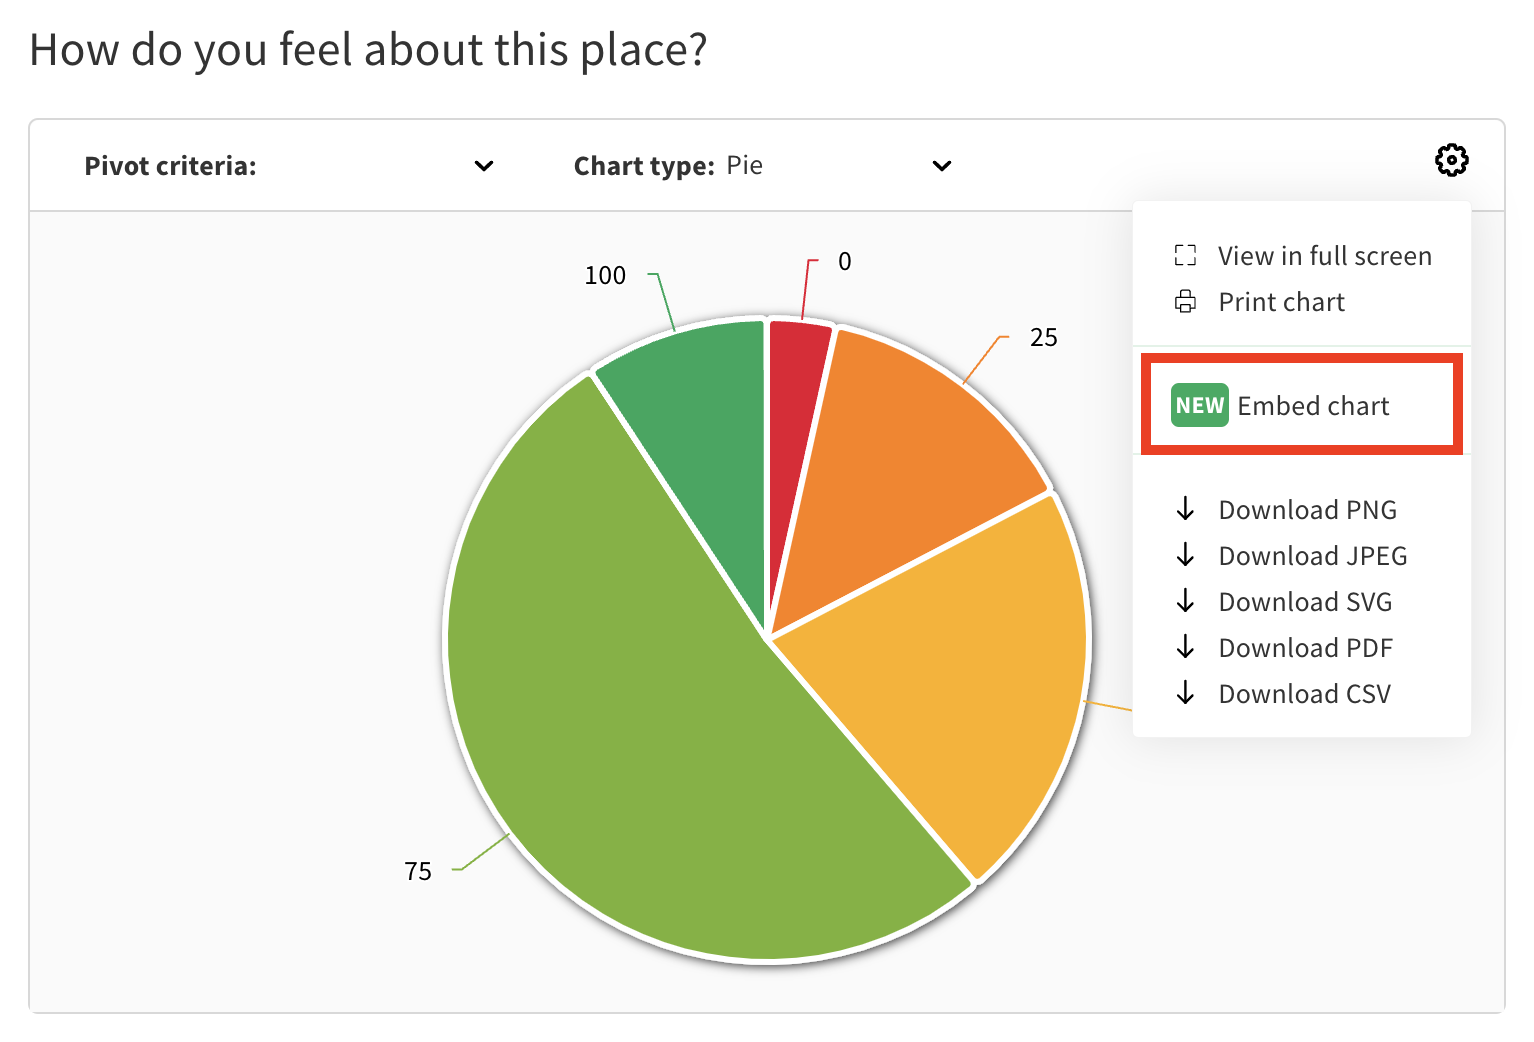
Select 'embed chart'
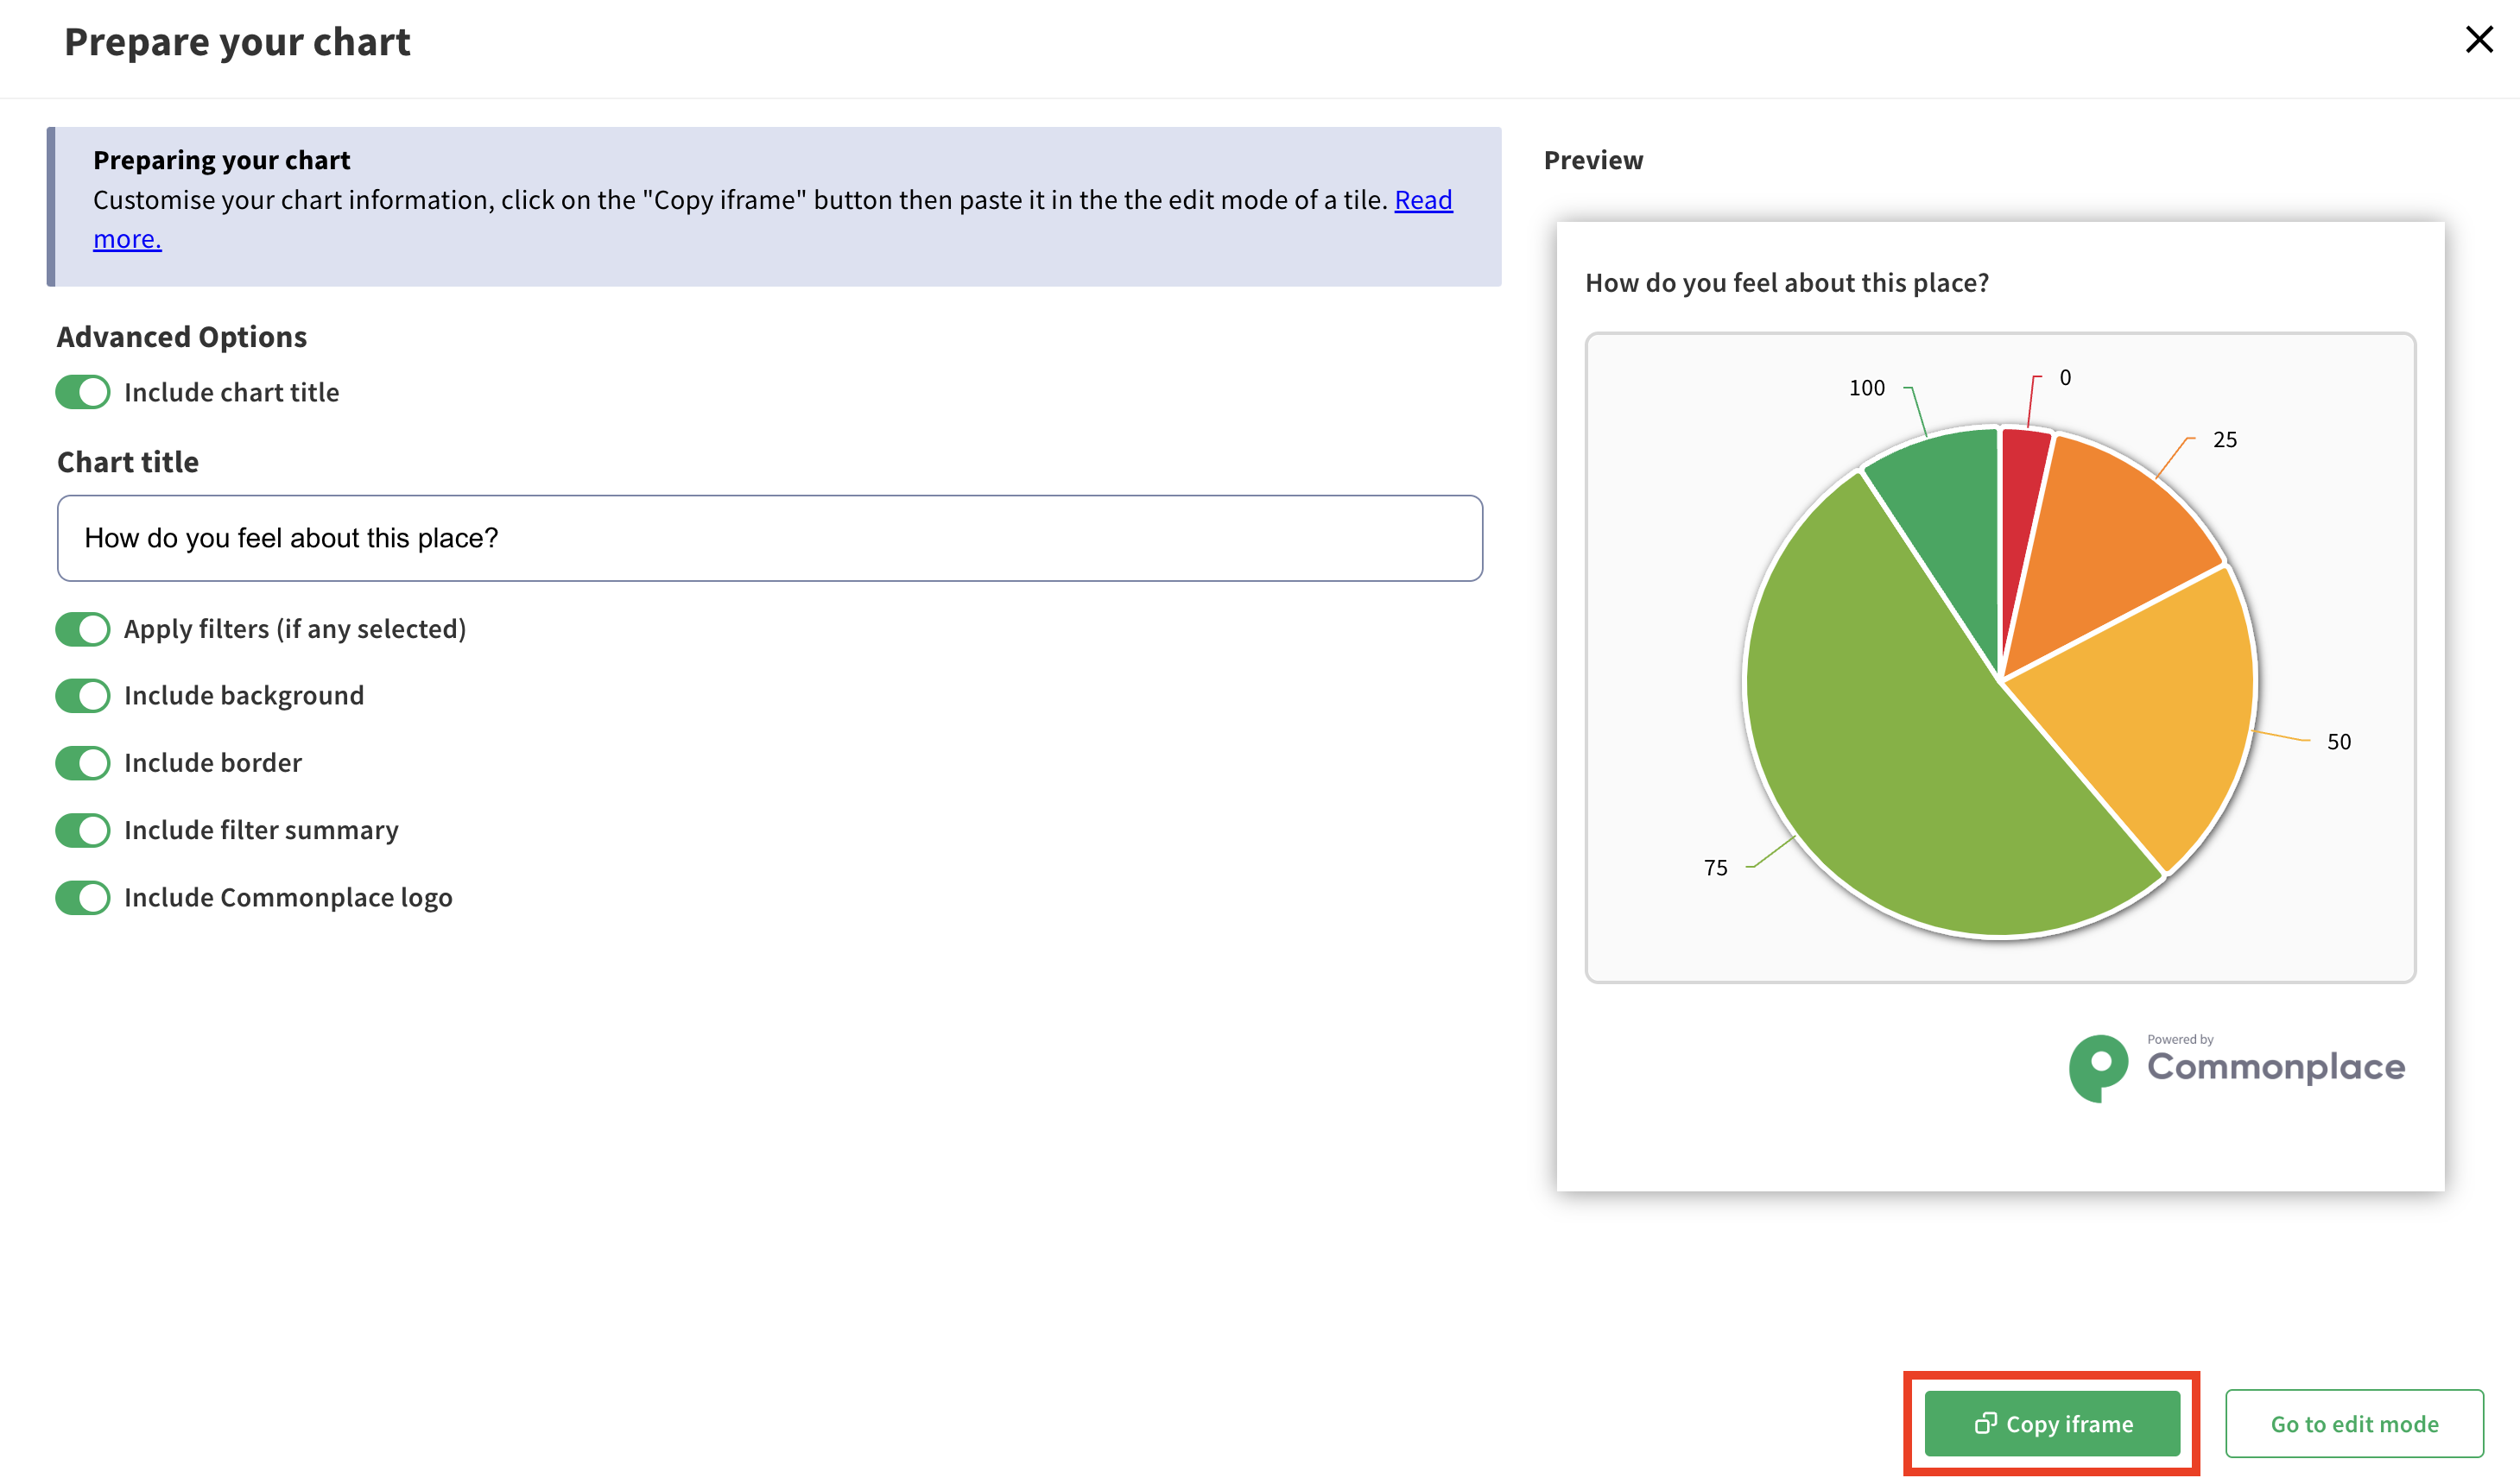
You can customise the appearance of your embedded chart - the following settings can be adjusted:
Include chart title
This will show or hide the chart title
Chart title field
If chart title is activated, you can customise the title here
Apply filters
If you have previously selected filters on your dashboard page, you can decide to keep them applied or not. If you didn’t select filters on your dashboard page, changing this setting won’t have any effect.
Include background
Show the default grey background or remove it to show a white background
Include border
Show or hide the default border around the chart
Include filter summary
If you had selected filters and for transparency, you can choose to display the filters that were selected to produce this chart. This is not turned off if you don't apply filters.
Include Commonplace logo
Show or hide the 'Powered by Commonplace' logo
Click 'copy iframe'
If you would like to embed your chart on a Commonplace page, click 'go to edit mode' - from edit mode you can select either an existing proposal tile or a new proposal tile.
Embedded charts, like any other iframe, can only be pasted in Text and Two column text component.
Once one of these components is in your page, click the <> icon to open the "html" editor mode
Paste the code that you had copied from the chart settings page. If you lost it, simply go back to the page and click the button again.
Once your code pasted, click the <> icon again to exit html mode, then save your changes.
Your charts are now dynamically integrated to your page!
Useful tips:
If you don't want your charts to be dynamic (new data will be added to it if your consultation is still ongoing), consider applying a date filter that will set it in time
You can also add your chart to any other website builder with html editors (Wordrpress, Notion, Webflow...)
Embedded charts can't be shared via emails, however you can share a link to your report to direct your community to view your results
Charts are particularly striking when mixed with text, don't hesitate to use the Two column text block to format your report
If you're adding large numbers of embedded charts, you may see faster page load speeds by adding the attribute below to each iframe. This will cause the charts only to load when the viewer reaches them.
loading="lazy"Still unsure about anything? There's lots more information here on the Commonplace Help Centre - alternatively, contact the support team and we'll be happy to help 👋