The respondents and contributions tabs in the dashboard can be filtered to give you a customisable view of your data.
Filters will narrow down the data you see in the tables, charts and exports.

There are several different types of filter available:
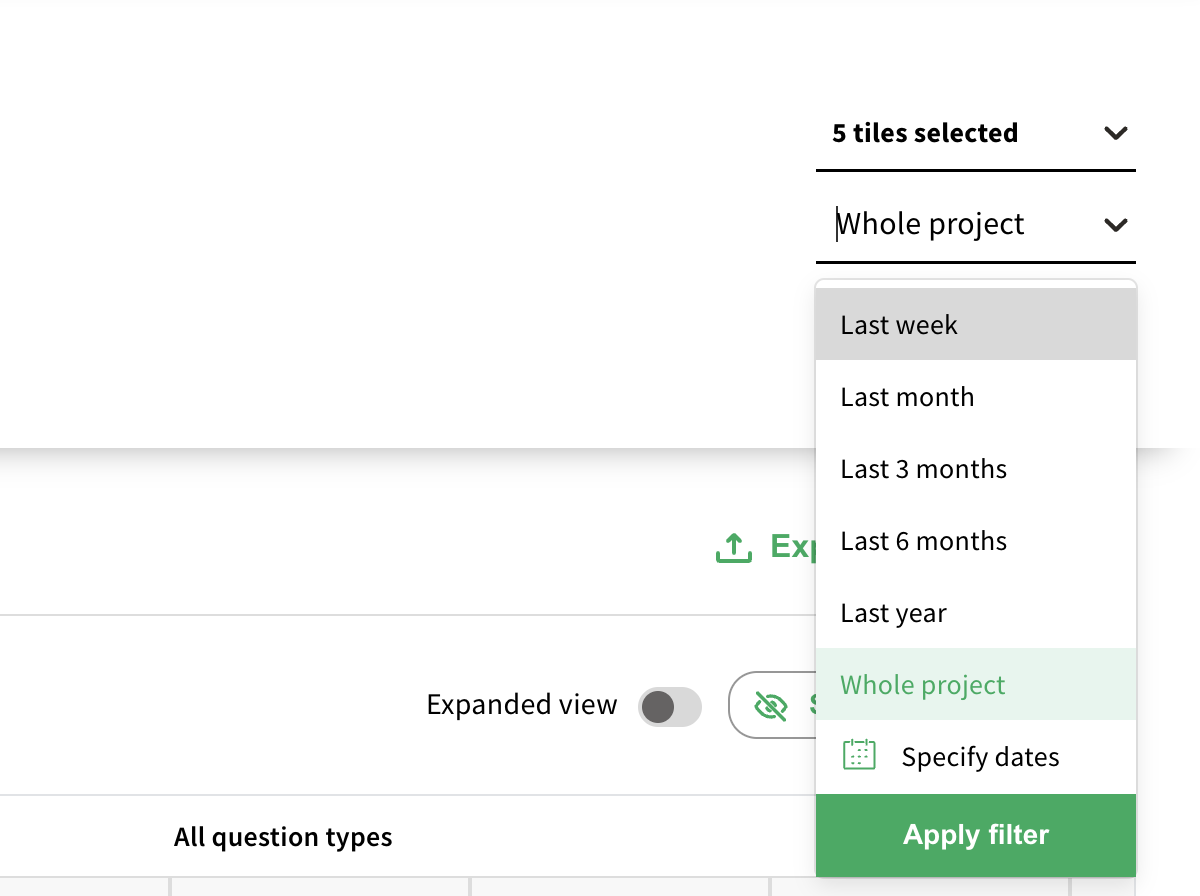
Use the date filter to look at data from a specific time period. In the respondents table the date filter applies to sign-up date, while in the contributions table the date filter applies to the date the contribution was made.
Several pre-set date ranges are available, or you can select specific start and end dates. To revert to seeing all data, select ‘whole project’.
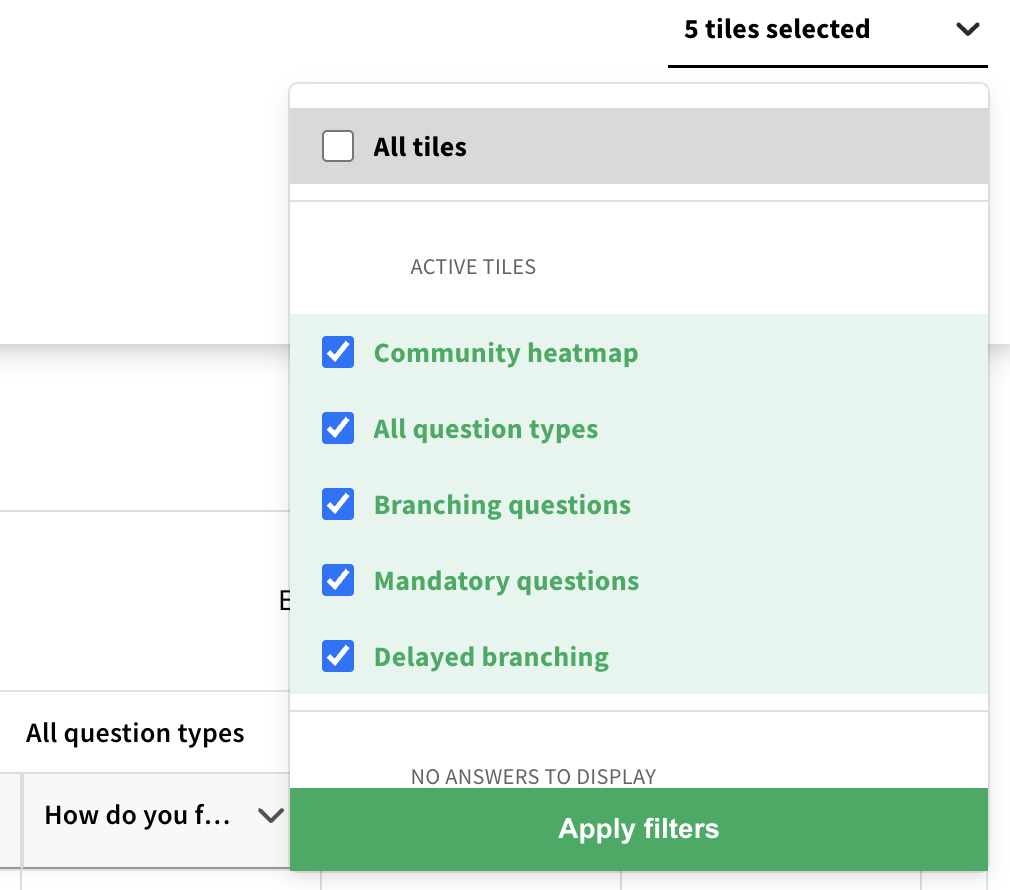
The tile filter only appears in the contributions tab. It lets you decide whether you want to see data from a specific tile, a specific group of tiles, or all tiles at the same time.
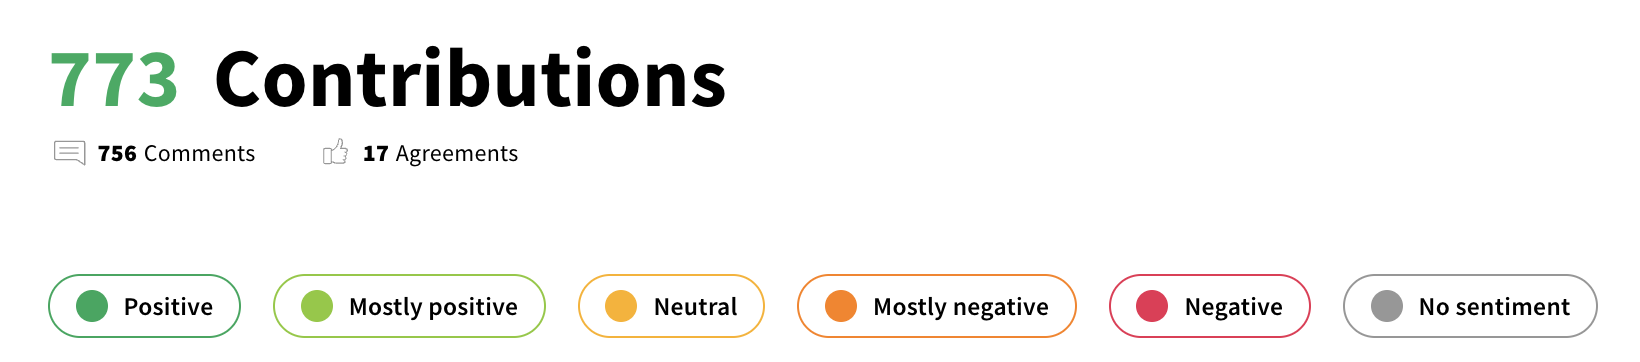
The quick filters give you a way to quickly see all comments of a specific sentiment.
Advanced filters can be accessed by the ‘filter’ button on the top right hand side of the table.
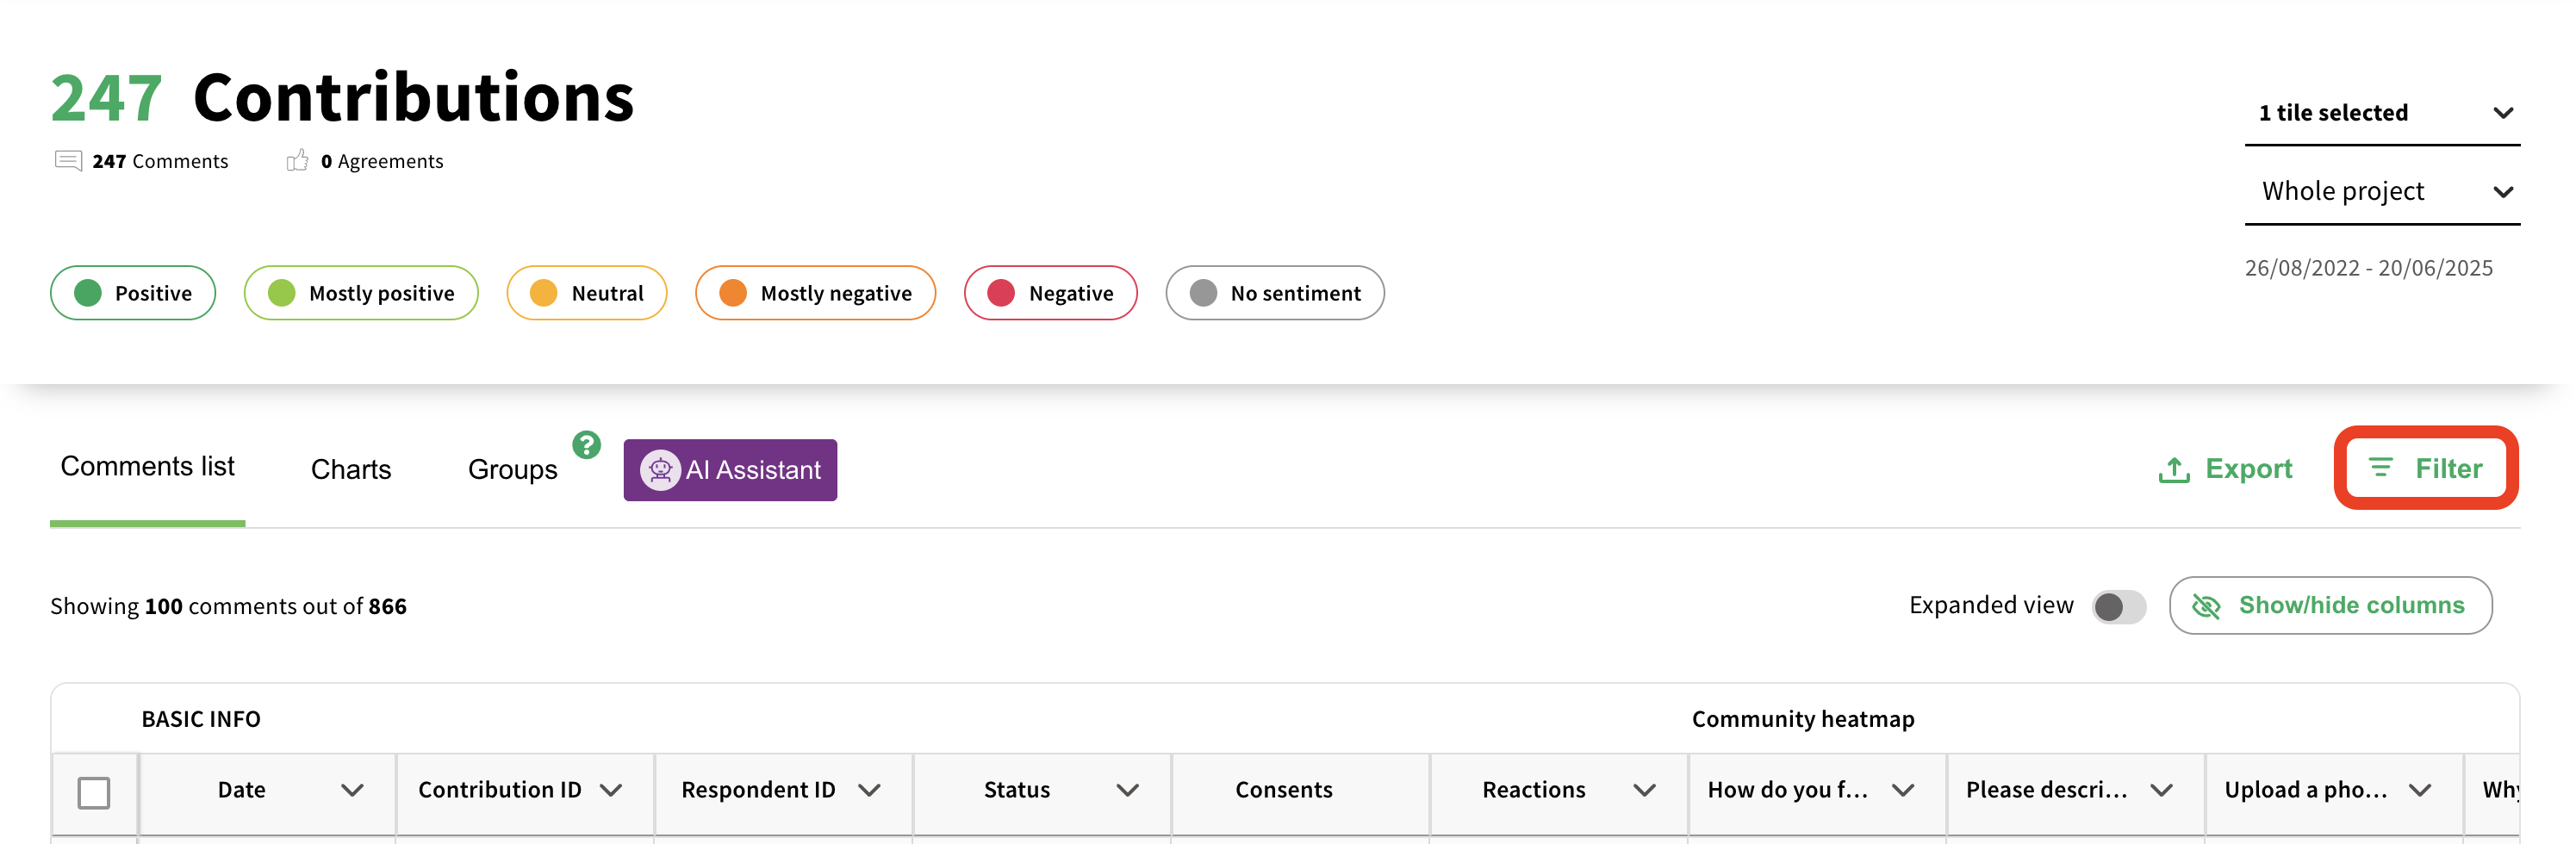
Advanced filters allow you filter by answers to specific questions, by demographic information about the respondent.
For example, we may to look at all responses by people living in the SW2 postcode. To do this, we apply a filter in the contributions tab for the ‘What is your home postcode?’ question. Make sure you set the filter to ‘contains’ or ‘starts with’, rather than ‘equals’.
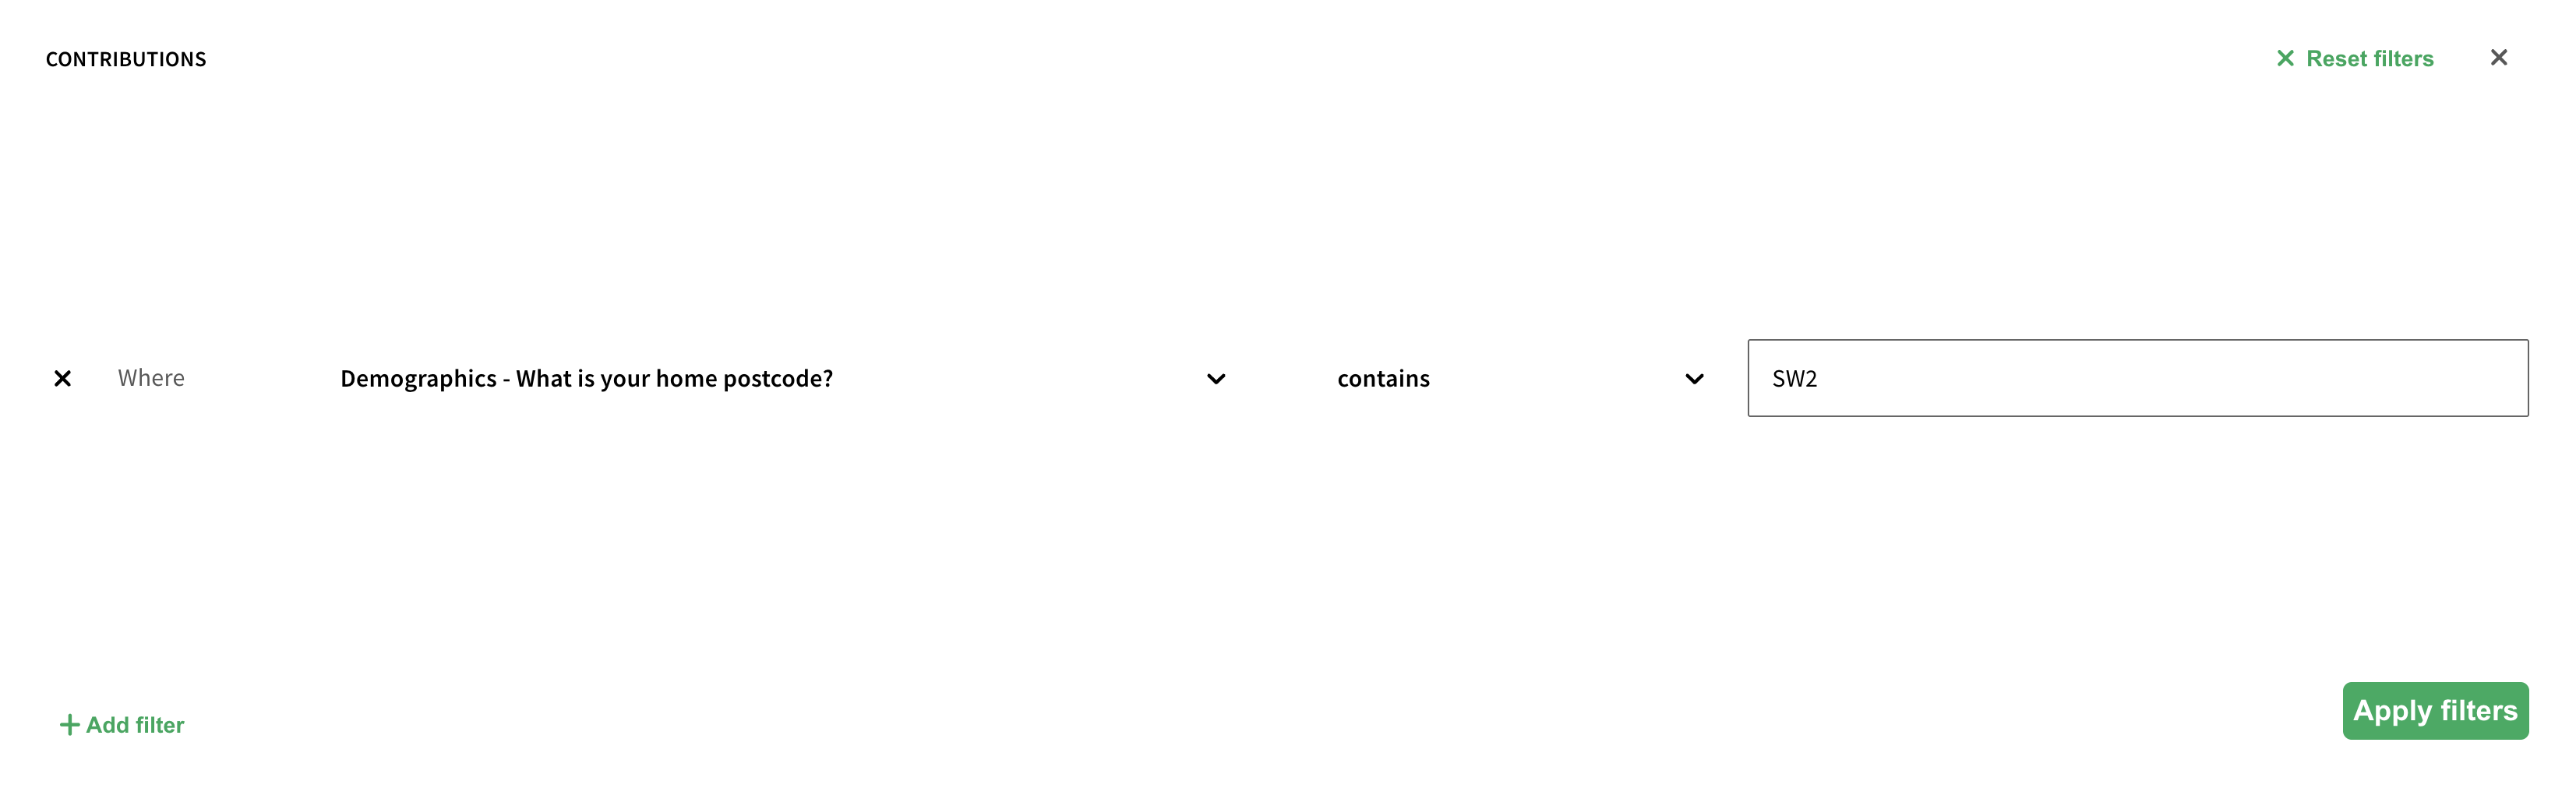
Multiple filters can be applied at the same time - perhaps we want to look at people who live in SW2 and feel unhappy about access to green space in their area.


Make sure you press ‘apply filters’ in the bottom right - you can also clear any filters you have applied by clicking ‘reset filters’ in the top right.
Still unsure about anything? There's lots more information here on the Commonplace Help Centre - alternatively, contact the support team and we'll be happy to help