Map layers enrich your map by providing extra information, context and visual interest. Layers can be added to your map either by hand-drawing them, or by uploading geospatial files such as Shapefiles or GeoJSONs. If you'd like to upload layers in bulk, read this article.
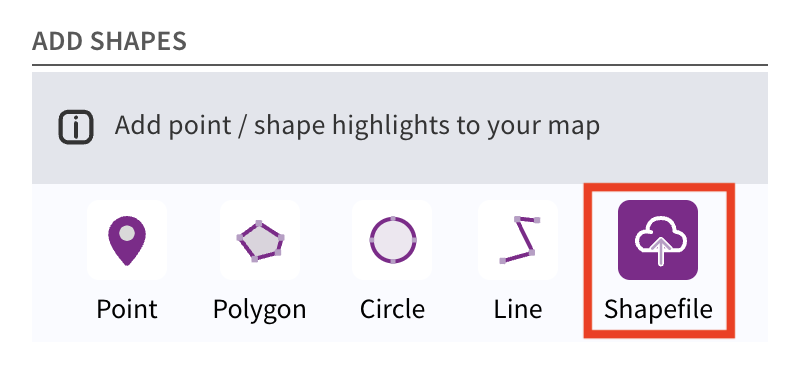
To add layers to your map, go to the 'Layers' tab. Under the 'Add shapes' menu you will see a series of icons allowing you to manually draw points, polygons, circles or lines. You can also upload geospatial data files such as Shapefiles or GeoJSONs.
To create a point click the 'Point' icon, then click on the map to set the location of your point.
Polygons are multi-sided shapes. To draw a polygon click the 'Polygon' icon, then click on the map to start drawing your shape. Click the first point in your shape again to complete it.
Circles can be used to indicate a given radius around a place. To draw a circle, click the 'Circle' icon and then click on the map - drag your mouse to set the radius of the circle, then click again to confirm.
Lines work well for indicating routes. To draw a line, click the 'Line' icon and then click on the map to start drawing. To complete the line, click the final point again.
Shapefile is a file format for mapping data. Shapefiles can contain multiple map 'features' - such as lines, points and polygons. Rather than being a single file, Shapefiles generally take the form of a .zip folder containing multiple files (.shp, .shx, .dbf and .prj) that describe the mapping data.
GeoJSON files contain similar data to Shapefiles, but in a slightly different format. GeoJSON files can also be uploaded to Commonplace maps.
Because Shapefiles can handle more complex data than can be drawn by hand, they're great for enriching your map with extra detail - for example ward boundaries or traffic interventions.
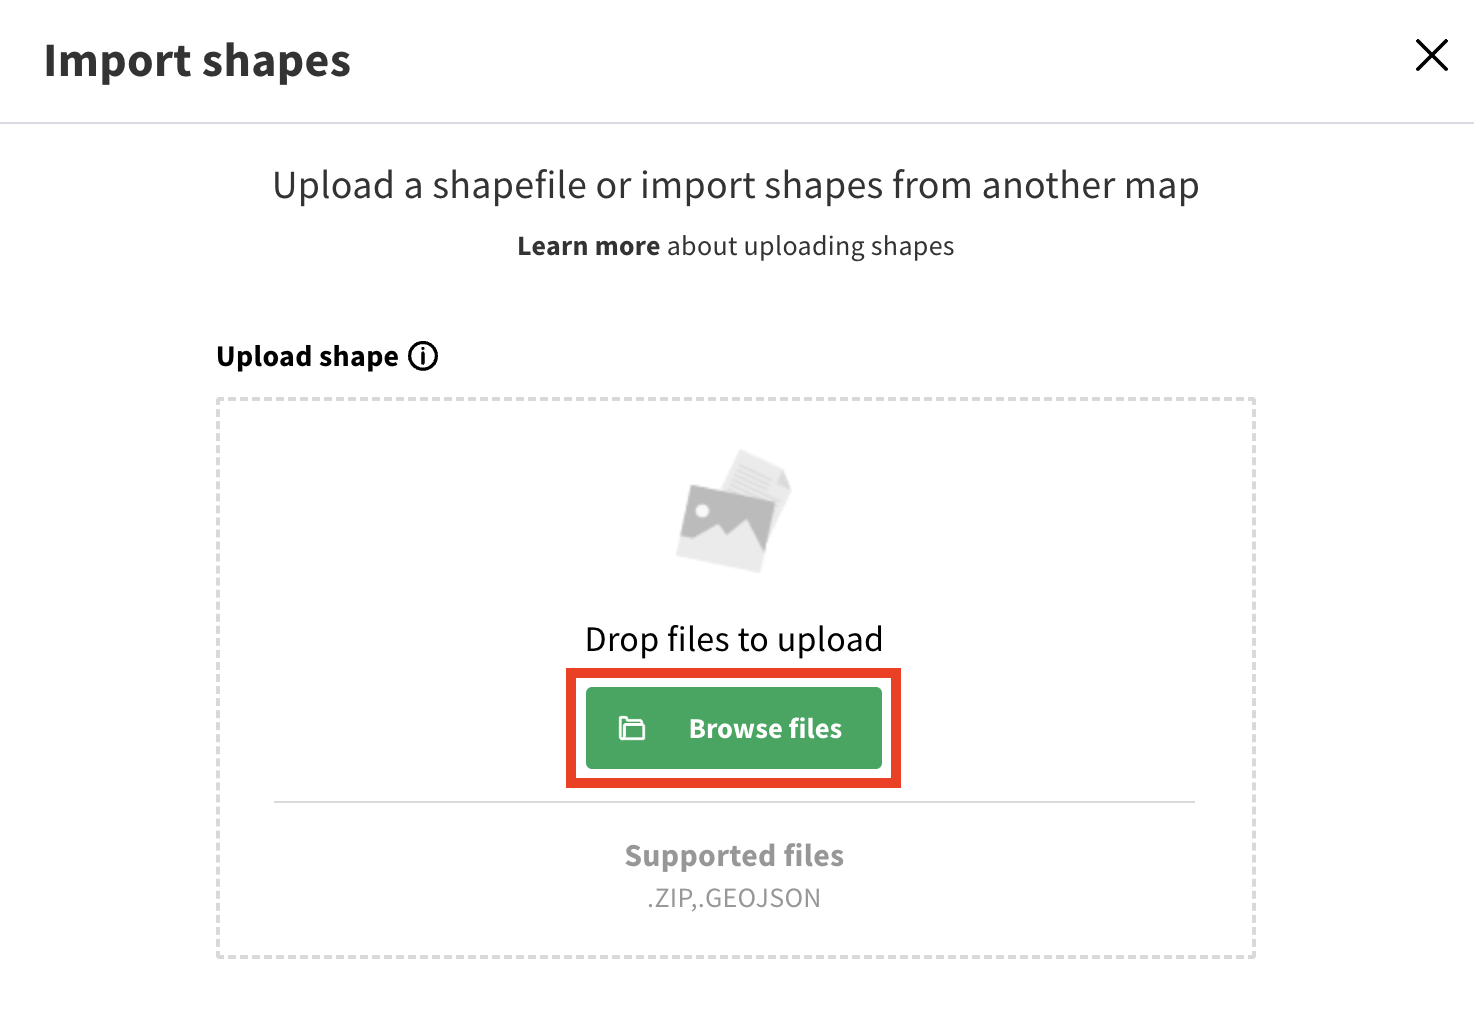
To upload a Shapefile to your map, click the 'Shapefile' icon. This will open a window with a file browser to select your file (either .zip or .geojson) - or you can import shapes from an existing map.
Once you have drawn or uploaded a layer, the 'Shape settings' box will appear. This contains the following settings:
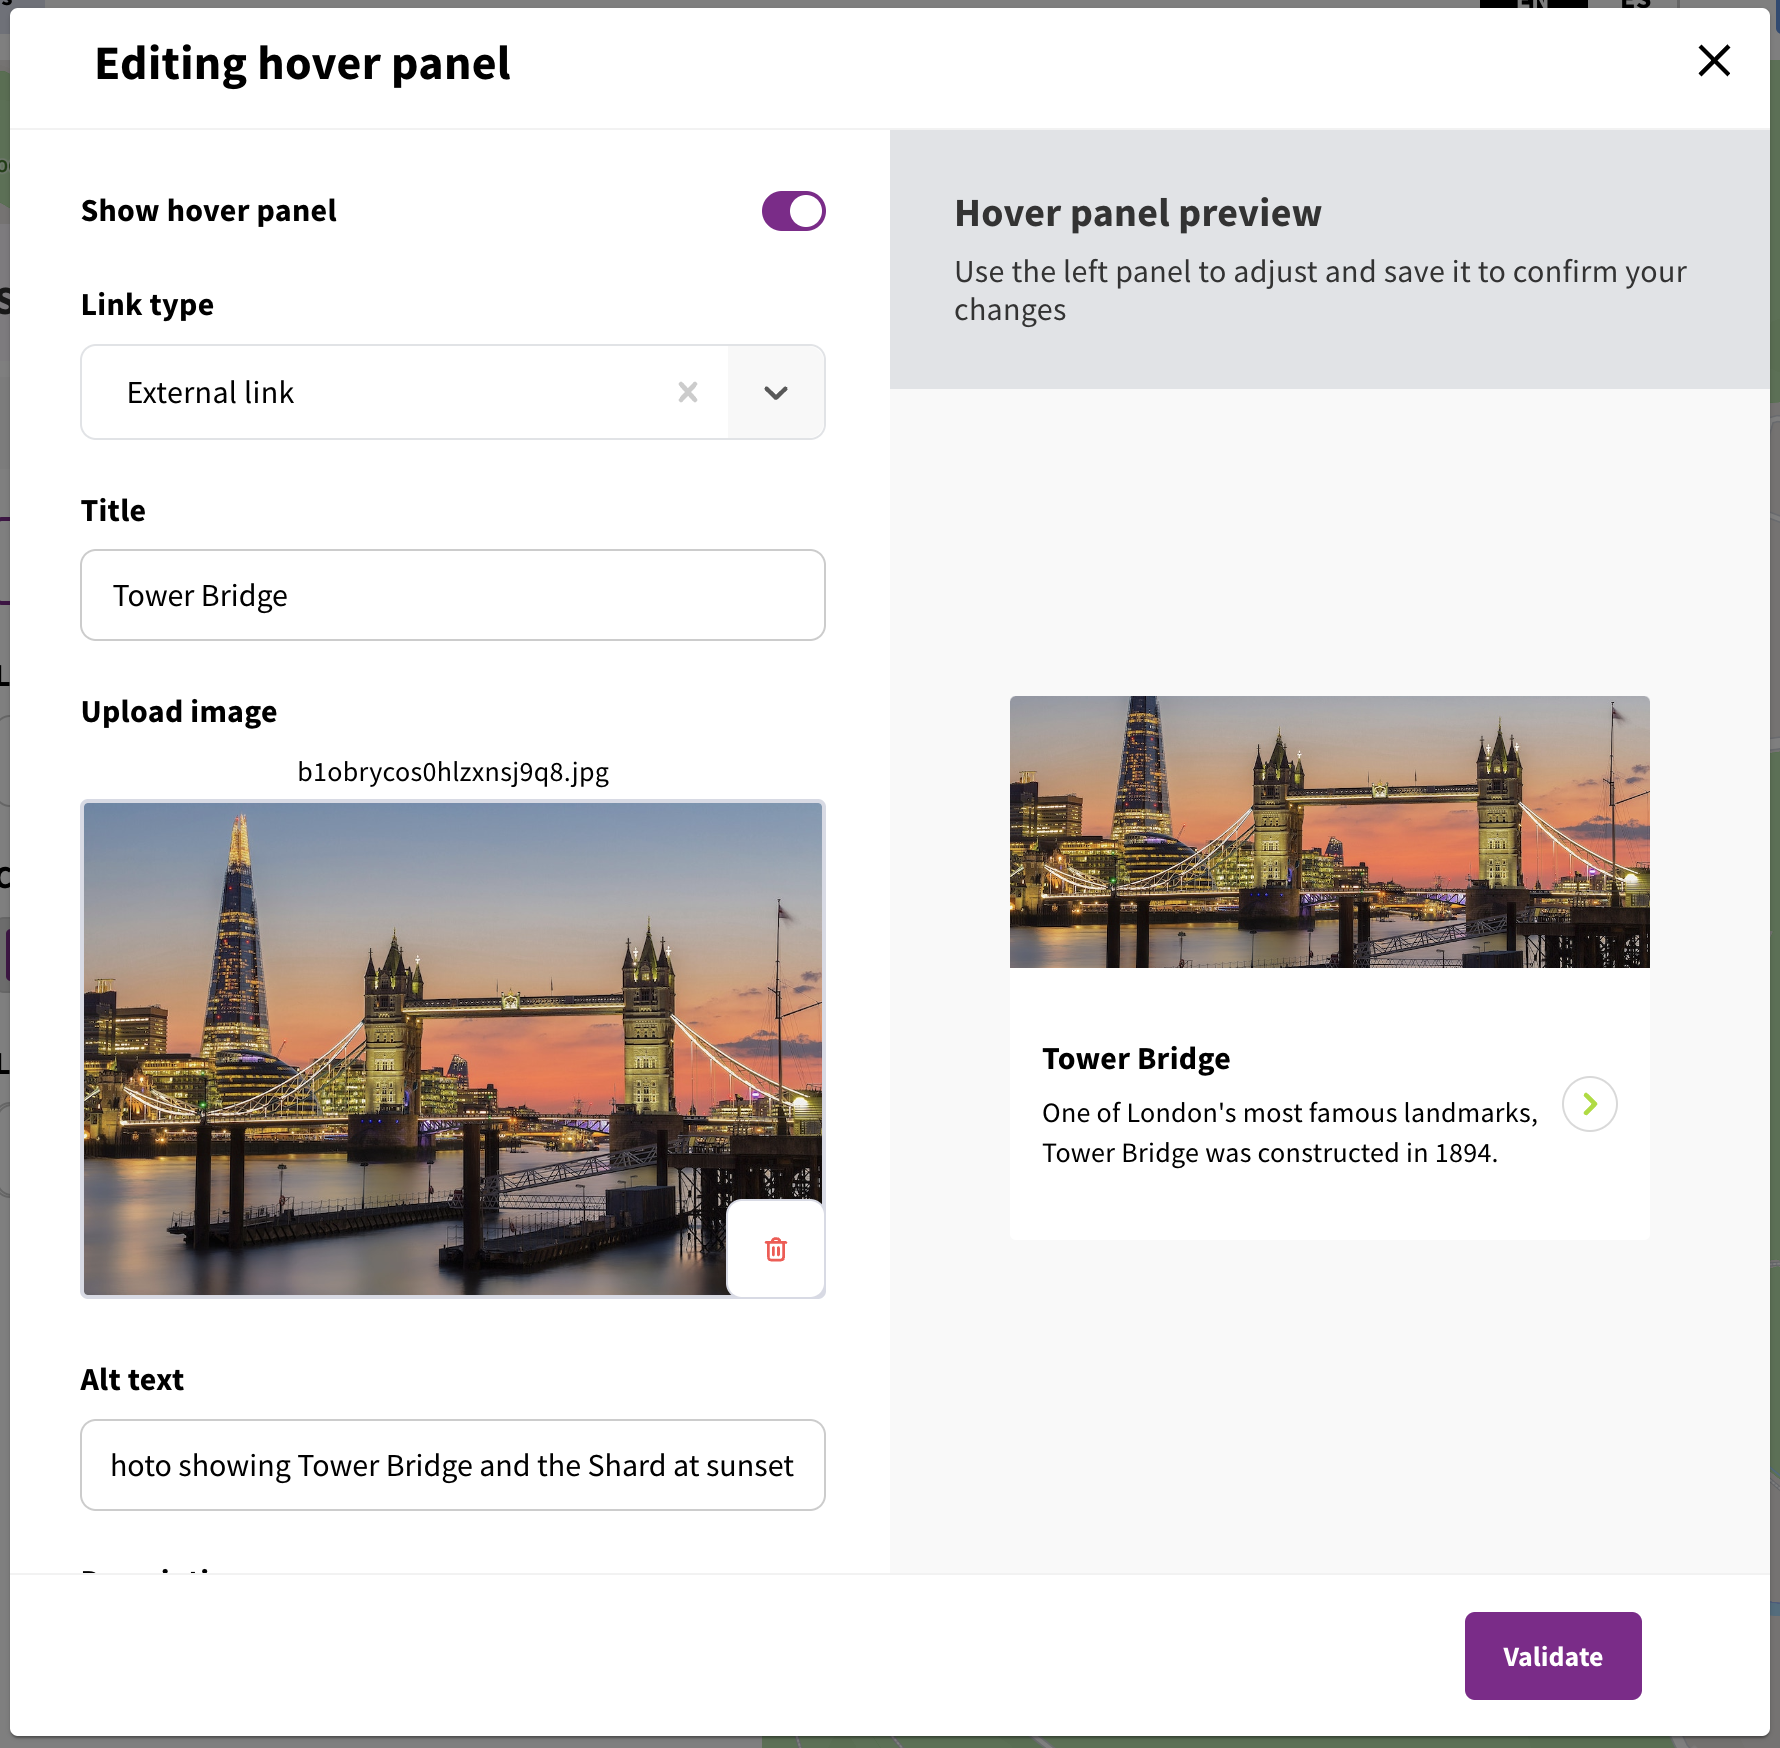
A hover panel is a small box that pops up when a user hovers over a shape with their mouse (or taps the shape on mobile devices). Hover panels contain an image, a title and a description. They can also include a link - either to an external website, or another tile on your project.
To add a hover panel to a shape, click 'Edit hover panel' - this will open a window with fields to populate the title, description, image, alt text and link. Links can either be to external sites, or to Commonplace tiles. If you choose the option to link to a Commonplace tile, you will then be able to choose the project and the tile you'd like the hover panel to link to.
Once you have finished populating your hover panel, click 'Apply changes' to check for errors and then 'Close' to save your hover panel.
Each shape must have a unique name - this will make it easier to find if you need to edit it later.
Points can use custom SVG icons instead of the default circle - using icons can make your map more visually interesting and easier to read. To add SVG icons, set the 'Customisation' setting from 'Standard' to 'Custom'. SVG files should have a 1:1 aspect ratio and dimensions between 24px and 36px wide/tall.
Each shape has one or more fields allowing you to customise the colours of the shape. Which fields are available will vary based on the type of layer - points can have a single colour, whereas polygons can have a fill colour, a line colour, a hover fill colour (visible when someone hovers over the shape with their mouse) and a hover line colour.
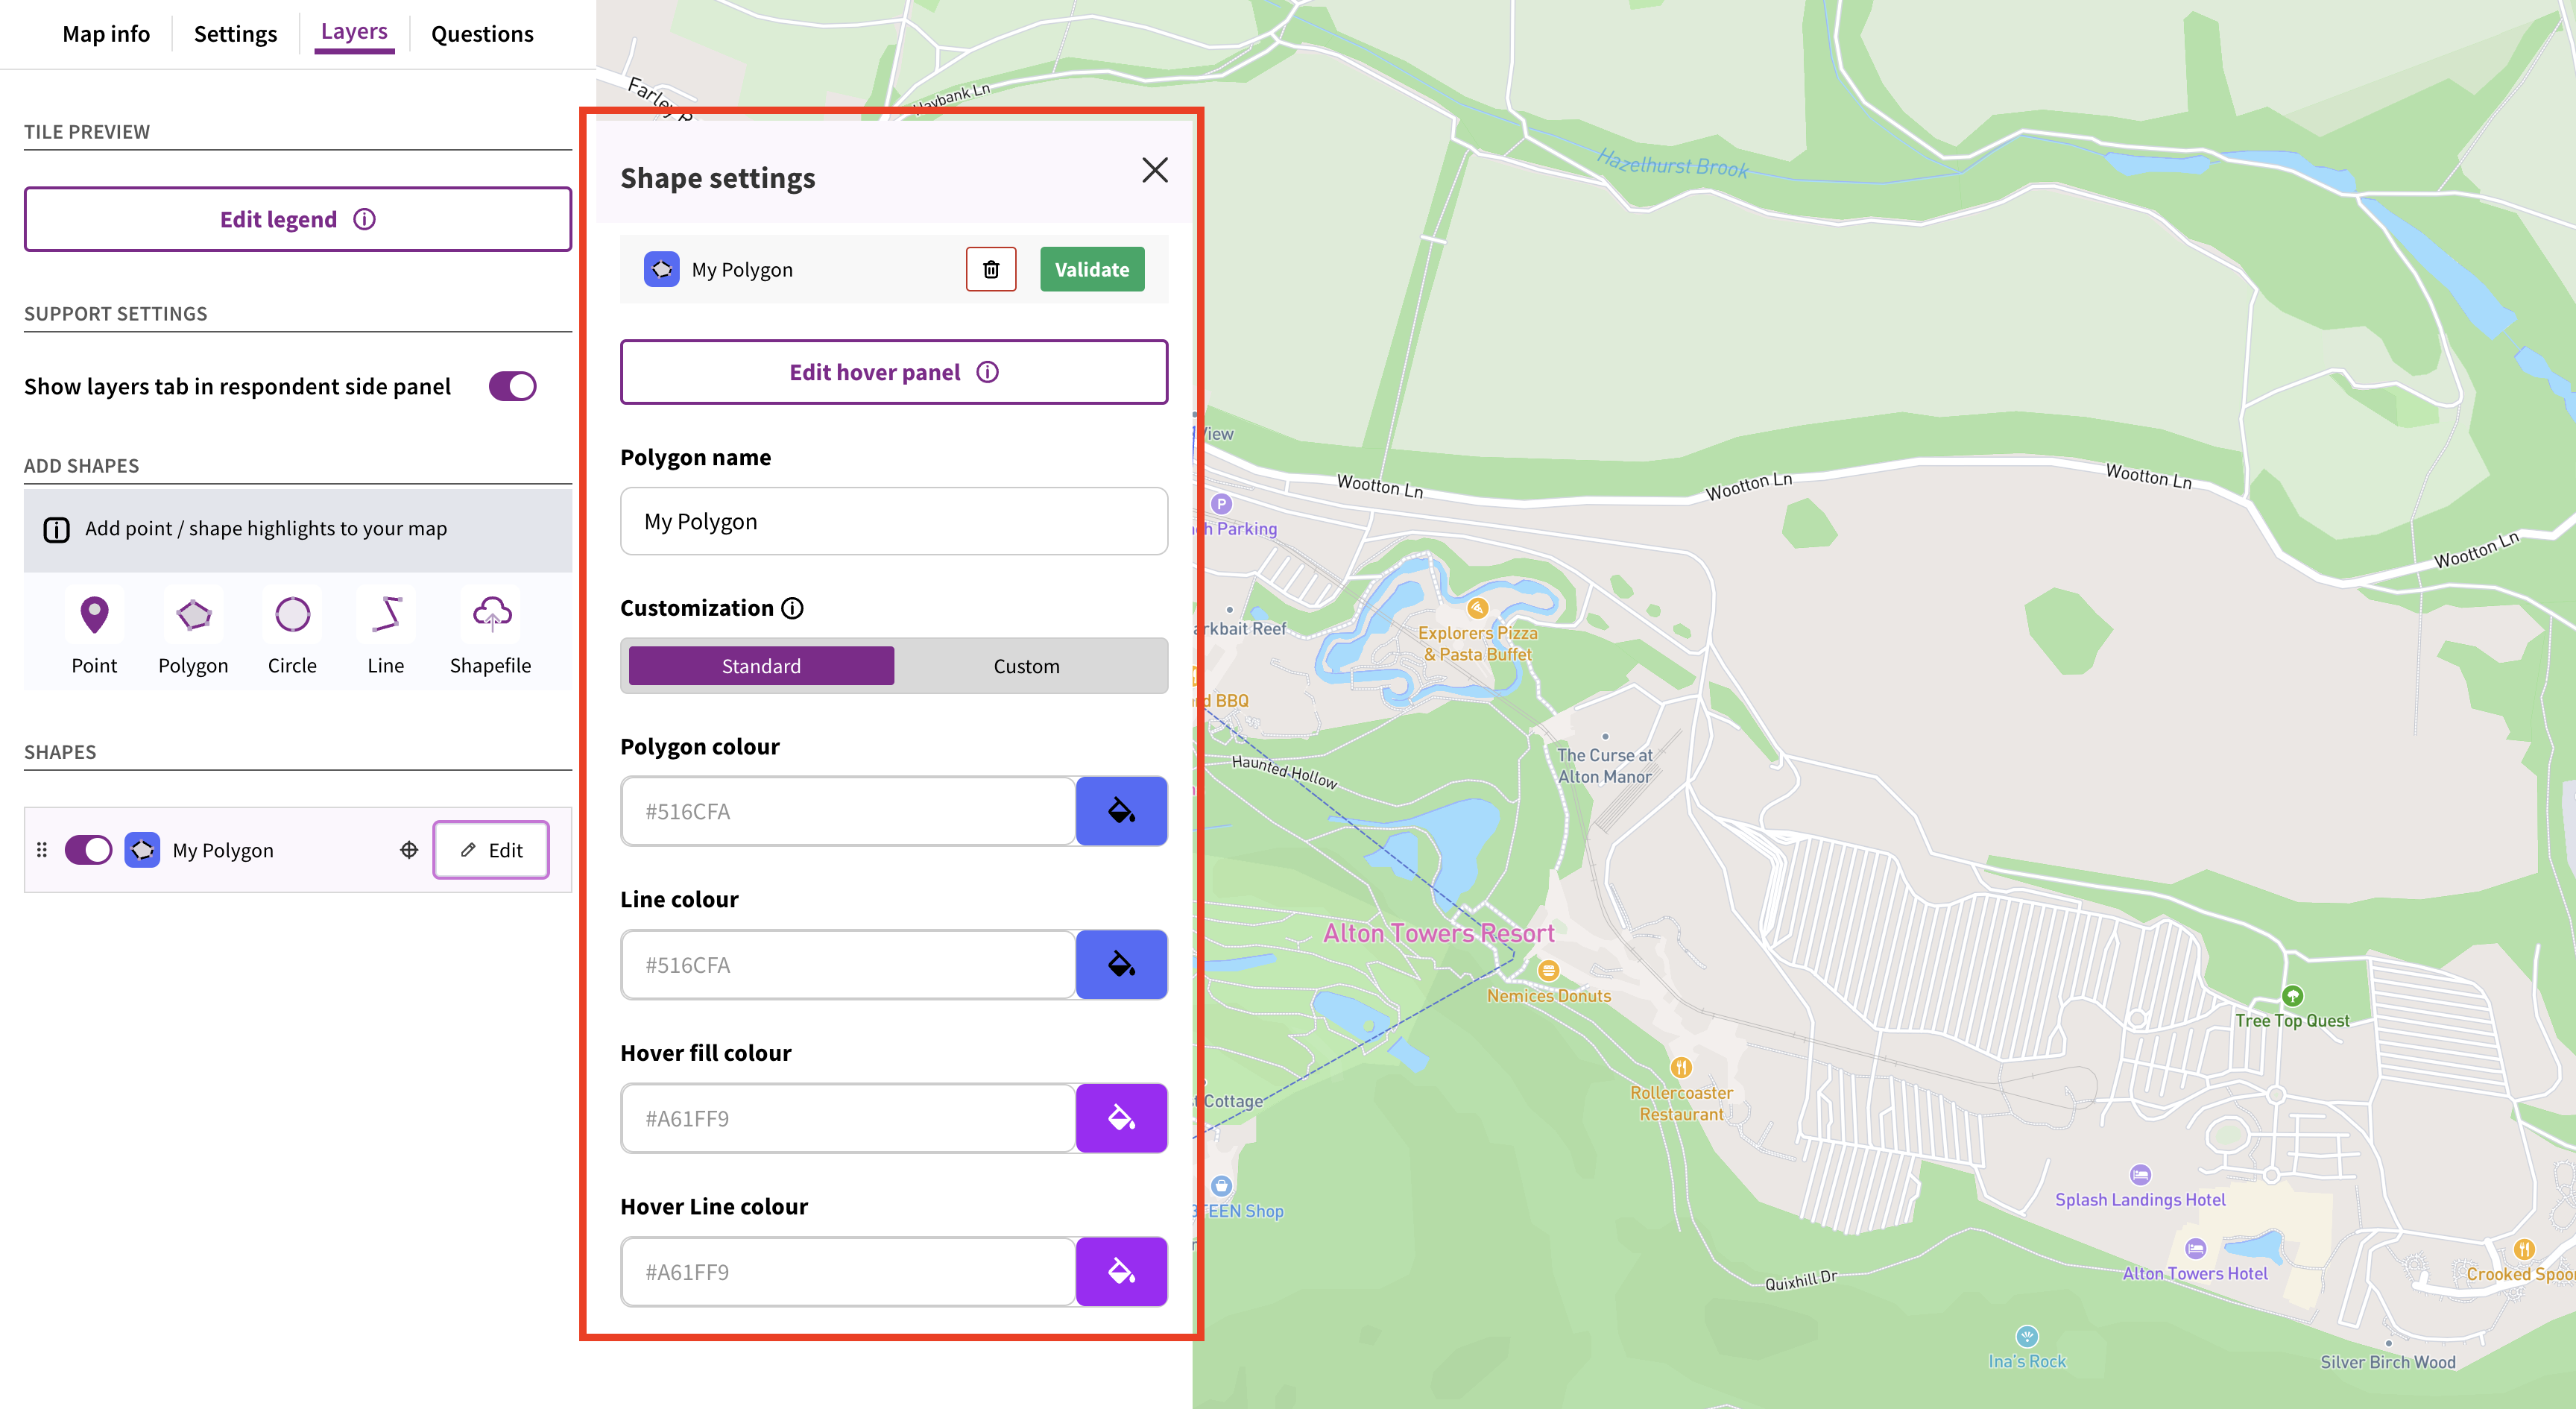

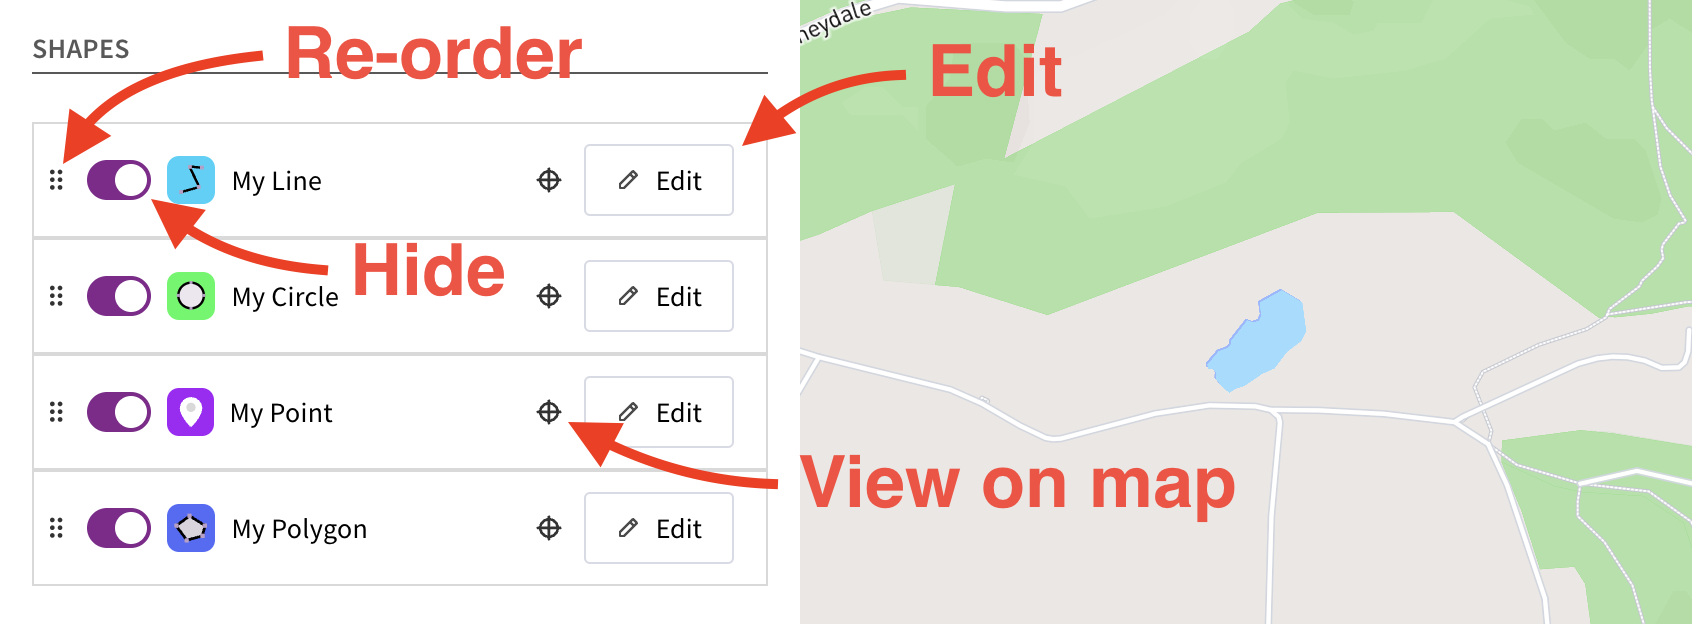
Shapes you have added will appear in the 'Shapes' list. From here they can be hidden using the toggle switch, or re-ordered by dragging and dropping. If you'd like to see where a shape is on the map, click the 'target' icon.
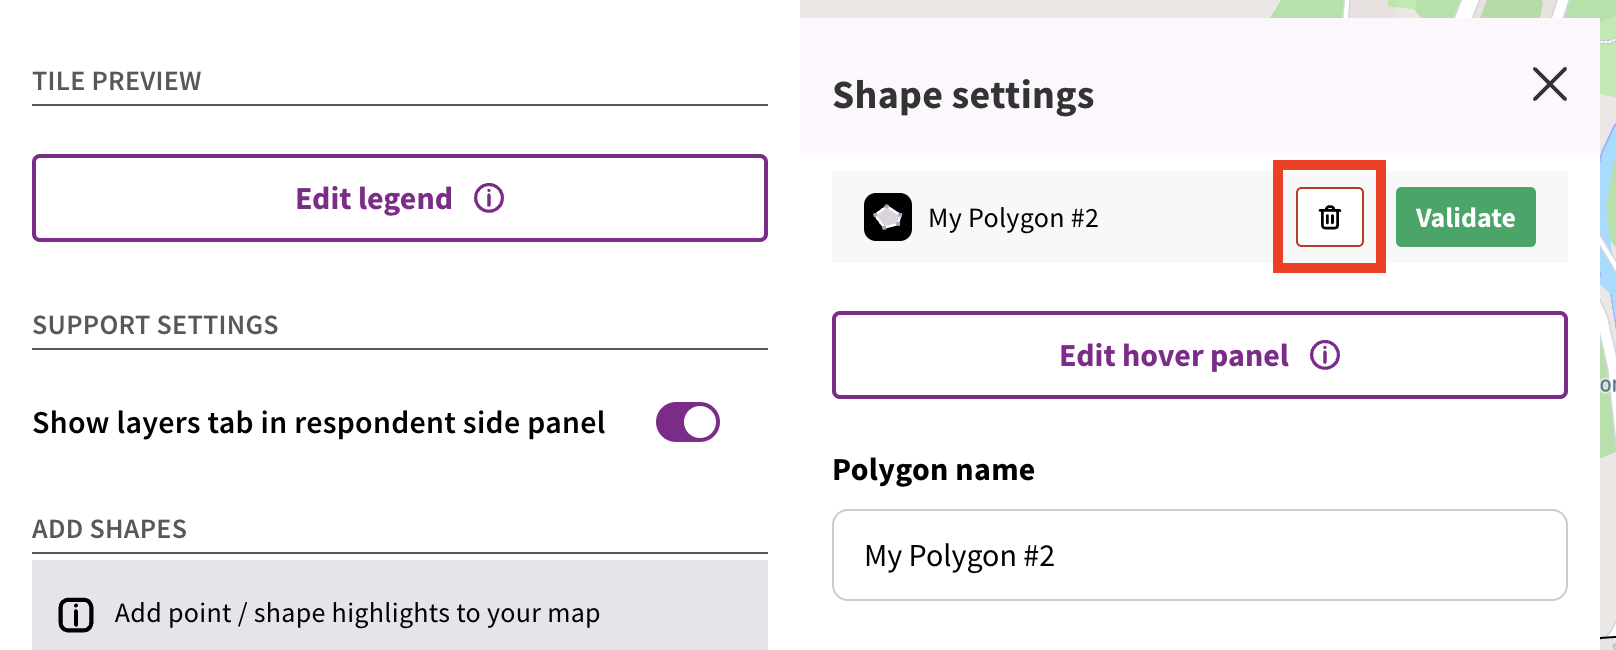
Click 'Edit' to amend the name, hover panel data, custom SVG icon or colour of a shape. You can also delete a shape by clicking the trash can icon (next to the 'Apply changes' button).
Introduction to maps / how to create and edit a map tile
Still unsure about anything? There's lots more information here on the Commonplace Help Centre - alternatively, contact the support team and we'll be happy to help 👋